Market Proxy is S&P 500. Returns greater than 1 year are annualized. Source: Bloomberg and Miller Value Partners
The data provided is from APX and Patient Capital Management, LLC and is believed to be reliable, but is not guaranteed as to its timeliness or accuracy. Percentages and returns may not sum to 100% due to rounding effects. A three-factor attribution consists of the allocation effect, selection effect, and the interaction effect, which sum to the portfolio's performance relative to the benchmark.
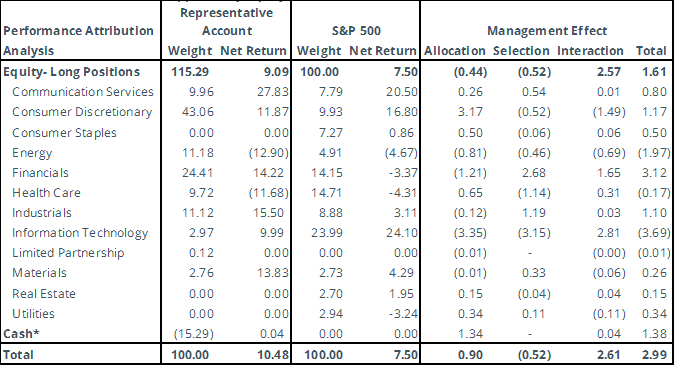
• Allocation. The allocation effect represents the portion of the portfolio's excess return attributable to differences in sector weights between the portfolio and the benchmark index.
• Selection. The selection effect represents the portion of the portfolio's excess return attributable to differences in the weights of individual securities within each sector between the portfolio and the benchmark index.
• Interaction. Most complex and sometimes counterintuitive, the interaction effect represents the portion of the portfolio’s excess return attributable to combining sector allocation decisions with security selection decisions, and is often thought of as measuring the accuracy of manager’s convictions.
Please note that the methodology used by our independent third-party attribution software vendor will at times present sector allocation effects that are counterintuitive. For example, the software may calculate a negative sector effect even when the portfolio, on a weighted average basis for the period, was overweight an outperforming sector. Under the vendor's methodology, allocation effects in recent months may overwhelm the allocation effects from earlier in the period, particularly over longer time frames.
Returns illustrated above are provided net of fees and include cash. Total portfolio return figures provided above reflect the sum of the returns of the holdings in the representative account portfolio due to price movements and dividend payments or other sources of income.
Fund Highlights
During the first quarter of 2023, the Opportunity Equity strategy generated a total return of 9.84% net of fees. In comparison, the Fund’s unmanaged benchmark, the S&P 500 Index, returned 7.50%.
Using a three-factor performance attribution model, allocation, and interaction effects contributed to the portfolio’s outperformance which was slightly offset by selection effect. Meta Platforms Inc., Coinbase Global Inc., Taylor Morrison Home Corp., Amazon.com Inc., and Alibaba Group Holdings were the largest contributors to performance, while Ovintiv Inc., Precigen Inc., Chesapeake Energy Corp., ADT Inc., and Puretech Health were the largest detractors.
Relative to the index, the fund was overweight the Consumer Discretionary, Financials, Industrials, Communication Services, Materials and Energy sectors on average during the quarter. With zero allocation to Real Estate, and Utilities the fund was underweight these sectors along with Consumer Staples, Information Technology, and Healthcare sectors.
The portfolio added three positions and eliminated two positions during the quarter, ending the quarter with 40 holdings where the top 10 represented 47.8% of total assets compared to 27.4% for the index, highlighting the fund’s meaningful active share of around 108.2%.
New and Eliminated
This quarter we entered three positions and exited two position. We took advantage of the early-March bank sell off to build a position in UBS Group (UBS) which purchased its largest local competitor, Credit Suisse, for an 80% discount to its February valuation. UBS Group is in a unique position to benefit from the acquisition as they have spent the last several years restructuring their own business by downsizing the Investment Bank and Fixed Income Unit while refocusing capital investment on Wealth Management. This has allowed the company to reach best in class return metrics hitting a Return on Common Equity Tier 1 (RoCET1) of 17.5% in 2021, within their long-term range of 15-18%. While the integration of Credit Suisse’s assets will make the financials messy for the next few years, the company should come out stronger on the other side with a substantially larger wealth management business, making up 68% of invested assets, and elevating them to be the #2 global player behind Morgan Stanley. We think EPS will be greater than $4, using reasonable assumptions, meaning you can buy the #2 Wealth Manager for less than 5x earnings. We think the stock can double from here for the patient investor.
We re-entered Peloton Interactive Inc. (PTON) in the quarter as the company began to right-size their cost structure, innovate their selling model and focus on reaching profitability. Peloton is the leader in the connected fitness space starting with the introduction of the at home spin-bike and expanding into treadmills, rowers and a digital app. We know this name well having purchased on the IPO and sold near the highs. The company benefited greatly from the pandemic as sales soared and people were forced to exercise from home. We like the new management team led by Barry McCarthy, a longtime Netflix executive. The company has taken drastic action to right-size the extremely bloated cost structure, expand sales channels (Amazon, Dick’s Sporting Goods), and test other ways to reinvigorate growth. Peloton customers continue to be extremely loyal with monthly churn remaining at just above 1%, in-line with the wireless industry churn. The value has always lived within the high-margin, sticky subscription piece of the business. Today, we see a very attractive risk/return skew with the ability to buy a brand leader in the market. We think the stock is easily worth multiples of the current price.
We re-entered Precigen Inc. (PGEN) with a small position during the quarter after taking tax-losses last year. Precigen is an early-stage biopharmaceutical company focused on next generation cell and gene therapies. The company has four lead clinical programs based on its proprietary therapeutic platforms, UltraCAR-T, AdenoVerse Immunotherapy, and ActoBiotics. The company’s UltraCAR-T program, if successful, has the potential to offer “off-the-shelf” CAR-T treatment allowing for rapid manufacturing, lower manufacturing costs, and patient scalability versus what is currently on the market. The company’s PRGN-2012 program in recurrent respiratory papillomatosis (RRP) has the potential to be the first-in-class investigational “off-the-shelf” AdenoVerse Immunotherapy with the company showing strong P1 results in January. As the company continues to make progress on these groundbreaking innovations, the company will look to push forward approval in orphan designations while continuing to prove out their new rapid manufacturing process. The company is run by Dr. Helen Sabzevari, who has extensive expertise in research and development of immunotherapy-based therapeutics having founded and served as Chief Scientific Officer of Compass Therapeutics. She has driven amazing clinical progress at PGEN over the past few years.
We used strong up-days to exit our positions in Silvergate Capital Corp (SI) common stock leading up to the announced closure of the bank in early March. We exited DXC Technologies (DXC) to fund new ideas.
Top Contributors and Top Detractors
| Top Contributors | Ticker | Net Contribution (bps) |
| Meta Platform Inc. | META | 201 |
| Coinbase Global Inc. | COIN | 177 |
| Taylor Morrison Home Corp. | TMHC | 120 |
| Amazon.com Inc. | AMZN | 105 |
| Alibaba Group Holdings | BABA | 83 |
| Top Contributors | Ticker | Net Contribution (bps) |
| Ovintiv Inc. | OVV | -148 |
| Precigen Inc. | PGEN | -49 |
| Chesapeake Energy Corp. | CHK | -48 |
| ADT Inc. | ADT | -37 |
| Puretech Health | PRTC LN | -34 |
*Contribution illustrated above are provided net of fees and includes cash.
Top Contributors
Meta Platform Inc. (META) was a top contributor to the Fund in Q1 after its worst annual performance as a public company in 2022. Mark Zuckerberg, Founder & CEO, framed 2023 as the ‘Year of Efficiency’ focusing on continued cost reductions, and a refocusing of priorities. The company lowered full year OPEX guidance by $8B and reduced their workforce by 25%. The topline is setup to benefit in 2023 despite potential macro concerns. The company’s investments in AI are starting to pay off with advertiser conversions up 20% year-over-year, Reels are driving strong engagement, and the hit a record high daily active user count. While not a base case, the potential ban of TikTok in the US would be an additional tailwind. The company increased their buyback authorization to $51B, an impressive ~10% of market cap at the time of the announcement. While the stock has had a strong move, we think there continues to be attractive return from here for a leading company that is finding cost discipline.
Coinbase Global Equity (COIN) gained an impressive 91% in the quarter, rebounding from its 86% decline in 2022. The correlation between Coinbase stock and Bitcoin – which gained 72% in Q1- has remained over 85% throughout its history. A restructuring plan led to a 20% reduction in the workforce and the de-prioritization of projects with a lower likelihood of success. During earnings, the company changed its tone around profitability, switching from a focus on being “breakeven through a cycle” to being “profitable in all market conditions”. With $5.5B in liquidity, the company has more flexibility than other money losing growth companies to reach profitability without external funding. With a renewed focus on profitability, we think they will get there faster than the market expects.
Taylor Morrison Home Corp. (TMHC) rebounded in the first quarter as interest rates declined from the highs seen in October 2022. Affordability continues to be a key concern for the market, but demand is strong year-to-date. The company continues to be selective in their land buying strategy putting them at an advantage over peers. Margins have remained resilient thanks to supply chain improvements. As production timelines revert to historical patterns, the company should see additional working capital benefits. While the near-term housing market is largely dependent on what rates do, we continue to believe we are in a structurally undersupplied position versus household formations. As consumers adjust to the new rate environment, we expect home sales to revert to normal sales patterns.
Top Detractors
Ovintiv Inc. (OVV) and Chesapeake Energy Corp. (CHK) were top detractors in the quarter following commodities prices lower over the period, particularly natural gas which fell 50%. Ovintinv continues to focus on maintenance level capital spending resulting in relatively flat production growth in 2023 with excess cash continuing to be allocated 50% to debt paydown, and 50% returned to shareholders. The company surprised investors with a large acquisition at the end of the quarter. Ovintiv purchased Core Midland Basin assets for $4.275B from EnCap Investments while simultaneously announcing the sale of its Bakken asset for $825M.
Chesapeake, a natural gas play, was hurt by the weakening natural gas price environment. The company has made steady progress is selling their remaining oily assets with only their south Eagle Ford asset remaining. The company continues to show discipline, reducing their rig count in response to weakening natural gas prices while hedging 55-60% of their 2024 production. The company laid out long-term plans to generate $6B in aggregate FCF from 2023-2027, representing 58% of their current market cap.
Despite near-term price weakness, we continue to believe there is a long-term imbalance in supply/demand. Over the long term, growing natural gas exports will increase demand with prices likely to follow. Across energy, companies continue to focus on returning cash to shareholders. This is unprecedented and suggests additional supply discipline. At the same time, demand should benefit from the re-opening of China and increased EU export demand. Combined, we think pricing will be more constructive going forward than in the past.
Precigen Inc. (PGEN) declined over the period following a run-up in January after releasing strong P1 data for PRGN-2012 in patients with severe recurrent respiratory papillomatosis (RRP), a population with a largely unmet need. The strong data sets up the company well for an expedited path to approval with talks ongoing with the FDA. The company took the opportunity to shore-up its balance sheet by raising $75m in equity financing extending its cash runway into late 2024. The company has a number of other pipeline data readouts throughout 2023. We continue to think this is an underappreciated biotech company run by a proven leader.
Common Recency Bias: In behavioral economics, recency bias (also known as availability bias) is the tendency for people to overweight new information or events without considering the objective probabilities of those events over the long run.
Return on Common Equity Tier 1 (RoCET1): Known as going concern or core capital, Tier 1 is used to fund a financial institution's business activities. It includes Common Equity Tier 1 (CET1) capital and Additional Tier 1 (AT1) capital.
Common Equity Tier 1 (CET1) is a component of Tier 1 capital that is primarily common stock held by a bank or other financial institution.
Additional Tier 1 capital is defined as instruments that are not common equity but are eligible for inclusion in this tier.
Operating Expenses (OPEX): An operating expense is an expense that a business incurs through its normal business operations. Often abbreviated as OpEx, operating expenses include rent, equipment, inventory costs, marketing, payroll, insurance, step costs, and funds allocated for research and development.
The performance figures reflect the deduction of a model investment management fee of 1% (the highest fee for separate accounts under our fee schedule) and certain other expenses. For important information about Opportunity Equity Strategy performance, please click on the Opportunity Equity Strategy Composite Performance Disclosure. The performance returns shown in this report are preliminary and are subject to revision. Past performance is no guarantee of future results. This additional information applies to such performance for all time periods.
All holdings and portfolio data are reflective of the representative account for the Opportunity Equity Strategy.
Contributors detailed above represent the top five securities that contributed positively to performance during the quarter. Detractors detailed above represent the top five securities that detracted from performance during the quarter. Information detailed above is provided net of fees, includes cash, and is based on a representative Opportunity Equity account. Contribution listed above represents the period when the security was held during the quarter. For additional information on how Top Contributors and Top Detractors were determined and/or to obtain a list showing every holding’s contribution to the representative Opportunity Equity account performance contact us.
The information presented should not be considered a recommendation to purchase or sell any security and should not be relied upon as investment advice. It should not be assumed that any purchase or sale decisions will be profitable or will equal the performance of any security mentioned. References to specific securities are for illustrative purposes only. Portfolio composition is shown as of a point in time and is subject to change without notice.
The views expressed in this commentary reflect those of Miller Value Partners analyst(s) as of the date of the commentary. Any views are subject to change at any time based on market or other conditions, and Miller Value Partners disclaims any responsibility to update such views. The information presented should not be considered a recommendation to purchase or sell any security and should not be relied upon as investment advice. It should not be assumed that any purchase or sale decisions will be profitable or will equal the performance of any security mentioned. Past performance is no guarantee of future results.
©2023 Miller Value Partners, LLC
Share