Strategy Highlights
During the first quarter of 2026, the Patient Opportunity Equity Strategy generated a total return of -5.96% net of fees. In comparison, the Strategy's unmanaged benchmark, the S&P 500 Index, returned -4.33%.
Using a three-factor performance attribution model, selection and interaction effects contributed to the portfolio's underperformance, which was partially offset by allocation effects. Royalty Pharma plc (RPRX), Noble Corporation plc (NE), Seadrill Limited (SDRL), Energy Transfer LP (ET), and Biogen Inc. (BIIB) were the largest contributors to performance, while UnitedHealth Group (UNH), Norwegian Cruise Line Holdings Ltd. (NCLH), Chime Financial Inc. (CHYM), Alphabet Inc. (GOOGL), and Meta Platforms Inc. (META) were the largest detractors.
Relative to the index, the strategy was overweight the Consumer Discretionary, Communication Services, Financials, Energy, Industrials, and Health Care sectors on average during the quarter. With zero allocation to Real Estate, Utilities, Materials, and Consumer Staples, the strategy was underweight these sectors along with Information Technology.
The portfolio entered two new positions, Adobe Inc. (ADBE) and iShares Bitcoin Trust ETF (IBIT), and exited four positions, Alibaba Group Holdings Ltd. (BABA), Fidelity Wise Origin Bitcoin Fund (FBTC), Mattel Inc. (MAT), and Peloton Interactive Inc. (PTON) during the quarter.
The portfolio ended the quarter with 36 holdings where the top 10 stocks represented 53.4% of total assets compared to 36.5% for the index, highlighting the strategy's meaningful active share of around 93.9%.
Portfolio Review
2026 began on strong footing, with markets reaching an all-time high in late January before a sharp reversal sent the S&P 500 down 9.8% from peak to trough, marking its 32nd correction greater than 5% since the 2009 low, before ending the quarter down 4.33%.
Concerns surrounding AI triggered a “SaaS pocalypse” as investors began questioning the terminal value of legacy software players, while large CAPEX announcements from hyperscalers raised doubts about their ability to generate adequate returns. Exposure to software debt and increasingly illiquid private markets sent shockwaves through the private credit space, prompting most publicly traded BDCs to cap redemptions. Adding to the pressure, escalating conflict in the Middle East drove a historic surge in crude oil prices, further increasing inflation risk.
The stand out performer in the quarter was Energy, a sector we entered the year with 2.7x exposure compared to the S&P500. Energy is a space we have continued to build conviction in over the years. We think of our energy exposure as an anti-fragile diversifier. In a world increasingly defined by geopolitical uncertainty, supply disruptions, and underinvestment in traditional production, energy is one of the few areas of the market that benefits when the unexpected happens. This quarter, that asymmetry paid off in a meaningful way. As always, price discipline is of utmost importance when investing in this sector. We prefer to add during periods of bearishness and low expectations.
The prevailing narrative at the start of the year was firmly negative. Consensus called for supply to outstrip demand, with Brent crude expected to average $58 for the year. We have long assessed our energy companies on through-cycle returns and normalized prices rather than near-term price forecasts. That discipline paid off, as the conflict in the Middle East and the closure of the Strait of Hormuz sent Brent prices to a high of $118, a level not seen since 2022 and roughly double where consensus expected prices to be in 2026.
Our energy exposure is focused on areas with attractive supply and demand dynamics that extend well beyond the commodity price itself. Noble Corporation plc (NE) and Seadrill Limited (SDRL) both operate in the highly consolidated offshore drilling market, a space that has narrowed to just three major players over the last several years. We have long believed that as onshore drilling supply tightens, offshore would become the incremental source of supply, and the dislocation following the closure of the Strait of Hormuz underscored that view. Our position in Energy Transfer LP (ET) is grounded in the belief that takeaway pipelines remain the binding constraint for domestic producers. With rising global demand for US energy exports, we believe Energy Transfer is well positioned to continue benefiting as one of the largest midstream operators in the country.
We benefited from our energy exposure this quarter because we were willing to own it when no one else wanted to. That willingness to buy out of favor assets and hold them with conviction until the market comes around is the foundation of everything we do.
New and Eliminated
This quarter we entered two new positions and exited four.
We initiated a position in Adobe Inc. (ADBE), a casualty of the “SaaS-pocalypse”. Adobe is the dominant platform for creative professionals, holding a near-monopoly position across document management, digital design, and marketing software. Despite this strong competitive position, the stock has been weighed down by investor concerns around AI disruption to its core creative tools business. We believe these fears are overblown. You do not need to believe much for there to be attractive upside in the name. The company's Document Cloud and Experience Cloud businesses represent durable, high-margin recurring revenue streams with limited disruption risk, and the company continues to incorporate AI into its product suite with its Firefly generative AI platform already beginning to monetize. If you simply believe the company can grow the bottom line at 7.5% annually over the next five years, the stock is worth roughly 60% more than where it trades today. The company continues to generate significant free cash flow, trading at a 10% FCF yield, and has returned meaningful capital to shareholders through buybacks, repurchasing a net 21% of shares outstanding over the last ten years.
We replaced our Fidelity Wise Origin Bitcoin Fund (FBTC) position with the iShares Bitcoin Trust ETF (IBIT), maintaining our long-term Bitcoin exposure in the strategy. Our long-term thesis remains unchanged. We continue to view Bitcoin as an early digital gold with a hard supply cap of 21 million coins. As Bitcoin becomes increasingly accessible through institutional-grade vehicles, demand should continue to grow while supply remains structurally limited. Today, Bitcoin sits at a market cap of only $1.4T compared to gold’s $33.3T market value.
We exited Alibaba Group Holdings Ltd (BABA) in the quarter as the stock reached our estimate of intrinsic value. We exited Mattel Inc. (MAT) and Peloton Interactive Inc. (PTON), both smaller positions, in the quarter to fund new ideas. Finally, we exited Fidelity Wise Origin Bitcoin Fund (FBTC) swapping the exposure into iShares Bitcoin Trust ETF (IBIT).
Top Contributors & Top Detractors
*Contribution and returns provided above are presented gross of fees and includes cash. For full performance of the strategy, please refer to the full performance information that follows the commentary below.
Top Contributors
Royalty Pharma plc (RPRX) was the top contributor to the strategy in the first quarter, gaining 25.6%. The stock demonstrated its durability in a quarter where elevated macro and market risks took center stage. The company is the world's largest buyer of biopharmaceutical royalties, providing capital to drug developers in exchange for a share of future revenues. This structure delivers broad pharmaceutical exposure while generating highly predictable, royalty-based cash flows. The company maintains strong deal discipline, consistently achieving unlevered IRRs in the low-teens and levered returns in the high-teens, and continues to find attractive opportunities as both early-stage companies and large pharma players seek non-dilutive financing. We continue to find the stock undervalued relative to the quality and predictability of its cash flow and expect the company to continue compounding shareholder returns in the mid-teens through a combination of royalty growth, dividend growth, and buybacks.
Noble Corporation plc (NE) and Seadrill Limited (SDRL) were top contributors during the first quarter, gaining 75.8% and 31.5%, respectively. Both stocks benefited from the spike in energy prices driven by escalating conflict in the Middle East, which renewed investor focus on the strategic importance of offshore supply. Noble is a leading offshore drilling contractor operating in the ultra-deepwater and harsh-environment segments, while Seadrill is the third largest independent offshore driller with a clean balance sheet following its emergence from bankruptcy in 2022. We think the offshore drilling market is attractive on a long-term basis, particularly as growth in land-based oil production continues to slow. Industry dynamics have steadily improved since 2019, with significant consolidation reducing the number of major players to just three. At the same time, nearly half of all deepwater rigs were scrapped over the past decade, and with minimal current capital investment, supply growth is expected to remain constrained for years to come. Both companies are well positioned to benefit as contract rates normalize upward and offshore drilling continues to play a growing role in global energy security. Noble continues to execute on its financial commitments, returning a substantial portion of free cash flow to shareholders through its dividend and buyback program, while Seadrill remains well positioned to either lead further industry consolidation or emerge as a compelling acquisition target.
Top Detractors
UnitedHealth Group (UNH) was the largest detractor in the first quarter, declining 15.7%. Shares came under pressure following a disappointing Medicare Advantage rate update, as CMS proposed just a 0.09% reimbursement increase for 2027, well below investor expectations for a mid-single-digit increase and insufficient to offset rising medical cost trends. However, as we entered the second quarter, CMS revised its final Medicare Advantage payment rate to a 2.48% increase, materially above the 0.09% initially proposed. We continue to believe UnitedHealth remains a category leader with a uniquely integrated platform spanning health benefits (Optum Health), pharmacy benefits management (Optum Rx), and health services (Optum Insight). The company's long-term earnings power and competitive positioning remain, in our view, intact. Management continues to target 13-16% long-term EPS growth, which they expect to resume in 2027. We took the pullback as an opportunity to increase our exposure at what we believe is a compelling valuation for a business of this quality. We remain patient in the interim collecting a 3% dividend yield supported by a consistent buyback program.
Norwegian Cruise Line Holdings Ltd. (NCLH) fell 16.1% in the quarter, pressured by weaker than expected 2026 guidance and increased geopolitical instability in the Middle East. The disappointing results reflected internal missteps. In response, the company announced the departure of CEO Harry Sommer and the immediate appointment of John Chidsey, who previously led successful turnarounds at both Subway and Burger King, as President and CEO. Elliott Investment Management, a well known activist investor, built a 10% economic position in the company and pushed aggressively for change. We are aware that Norwegian carries more leverage than its peers, which has made investors incrementally more cautious on the name. We believe this concern is manageable. In a normalized operating environment, the company generates substantial free cash flow and we are confident in its ability to pay down debt and strengthen its balance sheet over time. We continue to believe Norwegian is undervalued relative to its long-term earnings potential, trading at a significant discount to peers. With the majority of the pain being self-inflicted, we believe a new and focused management team alongside an experienced activist investor can put the company back on the right path in an industry with a compelling long-term setup, as sea-based vacations continue to offer a meaningful cost advantage over comparable land-based travel.
Chime Financial Inc. (CHYM) was a top detractor during the first quarter, declining 25.5%. The sell-off reflects continued investor caution around fintech and consumer credit as the macro environment creates questions around credit quality. We continue to believe Chime is a differentiated and well-positioned business. As a newly public company, near-term volatility is not unexpected. The platform's strong direct deposit-based model limits credit risk relative to peers, and the cross-sell opportunity within its existing engaged user base remains substantial. With a large and fragmented addressable market, improving product attach rates, and a clear path toward GAAP profitability, our long-term thesis on Chime remains intact. We view the current weakness as a reflection of near-term sentiment rather than any fundamental deterioration in the business.
During the first quarter of 2026, the Patient Opportunity Equity Strategy generated a total return of -5.96% net of fees. In comparison, the Strategy's unmanaged benchmark, the S&P 500 Index, returned -4.33%.
Using a three-factor performance attribution model, selection and interaction effects contributed to the portfolio's underperformance, which was partially offset by allocation effects. Royalty Pharma plc (RPRX), Noble Corporation plc (NE), Seadrill Limited (SDRL), Energy Transfer LP (ET), and Biogen Inc. (BIIB) were the largest contributors to performance, while UnitedHealth Group (UNH), Norwegian Cruise Line Holdings Ltd. (NCLH), Chime Financial Inc. (CHYM), Alphabet Inc. (GOOGL), and Meta Platforms Inc. (META) were the largest detractors.
Relative to the index, the strategy was overweight the Consumer Discretionary, Communication Services, Financials, Energy, Industrials, and Health Care sectors on average during the quarter. With zero allocation to Real Estate, Utilities, Materials, and Consumer Staples, the strategy was underweight these sectors along with Information Technology.
The portfolio entered two new positions, Adobe Inc. (ADBE) and iShares Bitcoin Trust ETF (IBIT), and exited four positions, Alibaba Group Holdings Ltd. (BABA), Fidelity Wise Origin Bitcoin Fund (FBTC), Mattel Inc. (MAT), and Peloton Interactive Inc. (PTON) during the quarter.
The portfolio ended the quarter with 36 holdings where the top 10 stocks represented 53.4% of total assets compared to 36.5% for the index, highlighting the strategy's meaningful active share of around 93.9%.
Portfolio Review
2026 began on strong footing, with markets reaching an all-time high in late January before a sharp reversal sent the S&P 500 down 9.8% from peak to trough, marking its 32nd correction greater than 5% since the 2009 low, before ending the quarter down 4.33%.
Concerns surrounding AI triggered a “SaaS pocalypse” as investors began questioning the terminal value of legacy software players, while large CAPEX announcements from hyperscalers raised doubts about their ability to generate adequate returns. Exposure to software debt and increasingly illiquid private markets sent shockwaves through the private credit space, prompting most publicly traded BDCs to cap redemptions. Adding to the pressure, escalating conflict in the Middle East drove a historic surge in crude oil prices, further increasing inflation risk.
The stand out performer in the quarter was Energy, a sector we entered the year with 2.7x exposure compared to the S&P500. Energy is a space we have continued to build conviction in over the years. We think of our energy exposure as an anti-fragile diversifier. In a world increasingly defined by geopolitical uncertainty, supply disruptions, and underinvestment in traditional production, energy is one of the few areas of the market that benefits when the unexpected happens. This quarter, that asymmetry paid off in a meaningful way. As always, price discipline is of utmost importance when investing in this sector. We prefer to add during periods of bearishness and low expectations.
The prevailing narrative at the start of the year was firmly negative. Consensus called for supply to outstrip demand, with Brent crude expected to average $58 for the year. We have long assessed our energy companies on through-cycle returns and normalized prices rather than near-term price forecasts. That discipline paid off, as the conflict in the Middle East and the closure of the Strait of Hormuz sent Brent prices to a high of $118, a level not seen since 2022 and roughly double where consensus expected prices to be in 2026.
Our energy exposure is focused on areas with attractive supply and demand dynamics that extend well beyond the commodity price itself. Noble Corporation plc (NE) and Seadrill Limited (SDRL) both operate in the highly consolidated offshore drilling market, a space that has narrowed to just three major players over the last several years. We have long believed that as onshore drilling supply tightens, offshore would become the incremental source of supply, and the dislocation following the closure of the Strait of Hormuz underscored that view. Our position in Energy Transfer LP (ET) is grounded in the belief that takeaway pipelines remain the binding constraint for domestic producers. With rising global demand for US energy exports, we believe Energy Transfer is well positioned to continue benefiting as one of the largest midstream operators in the country.
We benefited from our energy exposure this quarter because we were willing to own it when no one else wanted to. That willingness to buy out of favor assets and hold them with conviction until the market comes around is the foundation of everything we do.
New and Eliminated
This quarter we entered two new positions and exited four.
We initiated a position in Adobe Inc. (ADBE), a casualty of the “SaaS-pocalypse”. Adobe is the dominant platform for creative professionals, holding a near-monopoly position across document management, digital design, and marketing software. Despite this strong competitive position, the stock has been weighed down by investor concerns around AI disruption to its core creative tools business. We believe these fears are overblown. You do not need to believe much for there to be attractive upside in the name. The company's Document Cloud and Experience Cloud businesses represent durable, high-margin recurring revenue streams with limited disruption risk, and the company continues to incorporate AI into its product suite with its Firefly generative AI platform already beginning to monetize. If you simply believe the company can grow the bottom line at 7.5% annually over the next five years, the stock is worth roughly 60% more than where it trades today. The company continues to generate significant free cash flow, trading at a 10% FCF yield, and has returned meaningful capital to shareholders through buybacks, repurchasing a net 21% of shares outstanding over the last ten years.
We replaced our Fidelity Wise Origin Bitcoin Fund (FBTC) position with the iShares Bitcoin Trust ETF (IBIT), maintaining our long-term Bitcoin exposure in the strategy. Our long-term thesis remains unchanged. We continue to view Bitcoin as an early digital gold with a hard supply cap of 21 million coins. As Bitcoin becomes increasingly accessible through institutional-grade vehicles, demand should continue to grow while supply remains structurally limited. Today, Bitcoin sits at a market cap of only $1.4T compared to gold’s $33.3T market value.
We exited Alibaba Group Holdings Ltd (BABA) in the quarter as the stock reached our estimate of intrinsic value. We exited Mattel Inc. (MAT) and Peloton Interactive Inc. (PTON), both smaller positions, in the quarter to fund new ideas. Finally, we exited Fidelity Wise Origin Bitcoin Fund (FBTC) swapping the exposure into iShares Bitcoin Trust ETF (IBIT).
Top Contributors & Top Detractors
| Top Contributors | Ticker | Gross Contribution (bps) |
| Royalty Pharma plc | RPRX | 130 |
| Noble Corporation plc | NE | 99 |
| Seadrill Limited | SDRL | 88 |
| Energy Transfer LP | ET | 67 |
| Biogen Inc. | BIIB | 13 |
| Top Detractors | Ticker | Gross Contribution (bps) |
| UnitedHealth Group | UNH | -80 |
| Norwegian Cruise Line Holdings Ltd. | NCLH | -78 |
| Chime Financial Inc | CHYM | -60 |
| Alphabet Inc. | GOOG | -59 |
| Meta Platforms, Inc. | META | -55 |
*Contribution and returns provided above are presented gross of fees and includes cash. For full performance of the strategy, please refer to the full performance information that follows the commentary below.
Top Contributors
Royalty Pharma plc (RPRX) was the top contributor to the strategy in the first quarter, gaining 25.6%. The stock demonstrated its durability in a quarter where elevated macro and market risks took center stage. The company is the world's largest buyer of biopharmaceutical royalties, providing capital to drug developers in exchange for a share of future revenues. This structure delivers broad pharmaceutical exposure while generating highly predictable, royalty-based cash flows. The company maintains strong deal discipline, consistently achieving unlevered IRRs in the low-teens and levered returns in the high-teens, and continues to find attractive opportunities as both early-stage companies and large pharma players seek non-dilutive financing. We continue to find the stock undervalued relative to the quality and predictability of its cash flow and expect the company to continue compounding shareholder returns in the mid-teens through a combination of royalty growth, dividend growth, and buybacks.
Noble Corporation plc (NE) and Seadrill Limited (SDRL) were top contributors during the first quarter, gaining 75.8% and 31.5%, respectively. Both stocks benefited from the spike in energy prices driven by escalating conflict in the Middle East, which renewed investor focus on the strategic importance of offshore supply. Noble is a leading offshore drilling contractor operating in the ultra-deepwater and harsh-environment segments, while Seadrill is the third largest independent offshore driller with a clean balance sheet following its emergence from bankruptcy in 2022. We think the offshore drilling market is attractive on a long-term basis, particularly as growth in land-based oil production continues to slow. Industry dynamics have steadily improved since 2019, with significant consolidation reducing the number of major players to just three. At the same time, nearly half of all deepwater rigs were scrapped over the past decade, and with minimal current capital investment, supply growth is expected to remain constrained for years to come. Both companies are well positioned to benefit as contract rates normalize upward and offshore drilling continues to play a growing role in global energy security. Noble continues to execute on its financial commitments, returning a substantial portion of free cash flow to shareholders through its dividend and buyback program, while Seadrill remains well positioned to either lead further industry consolidation or emerge as a compelling acquisition target.
Top Detractors
UnitedHealth Group (UNH) was the largest detractor in the first quarter, declining 15.7%. Shares came under pressure following a disappointing Medicare Advantage rate update, as CMS proposed just a 0.09% reimbursement increase for 2027, well below investor expectations for a mid-single-digit increase and insufficient to offset rising medical cost trends. However, as we entered the second quarter, CMS revised its final Medicare Advantage payment rate to a 2.48% increase, materially above the 0.09% initially proposed. We continue to believe UnitedHealth remains a category leader with a uniquely integrated platform spanning health benefits (Optum Health), pharmacy benefits management (Optum Rx), and health services (Optum Insight). The company's long-term earnings power and competitive positioning remain, in our view, intact. Management continues to target 13-16% long-term EPS growth, which they expect to resume in 2027. We took the pullback as an opportunity to increase our exposure at what we believe is a compelling valuation for a business of this quality. We remain patient in the interim collecting a 3% dividend yield supported by a consistent buyback program.
Norwegian Cruise Line Holdings Ltd. (NCLH) fell 16.1% in the quarter, pressured by weaker than expected 2026 guidance and increased geopolitical instability in the Middle East. The disappointing results reflected internal missteps. In response, the company announced the departure of CEO Harry Sommer and the immediate appointment of John Chidsey, who previously led successful turnarounds at both Subway and Burger King, as President and CEO. Elliott Investment Management, a well known activist investor, built a 10% economic position in the company and pushed aggressively for change. We are aware that Norwegian carries more leverage than its peers, which has made investors incrementally more cautious on the name. We believe this concern is manageable. In a normalized operating environment, the company generates substantial free cash flow and we are confident in its ability to pay down debt and strengthen its balance sheet over time. We continue to believe Norwegian is undervalued relative to its long-term earnings potential, trading at a significant discount to peers. With the majority of the pain being self-inflicted, we believe a new and focused management team alongside an experienced activist investor can put the company back on the right path in an industry with a compelling long-term setup, as sea-based vacations continue to offer a meaningful cost advantage over comparable land-based travel.
Chime Financial Inc. (CHYM) was a top detractor during the first quarter, declining 25.5%. The sell-off reflects continued investor caution around fintech and consumer credit as the macro environment creates questions around credit quality. We continue to believe Chime is a differentiated and well-positioned business. As a newly public company, near-term volatility is not unexpected. The platform's strong direct deposit-based model limits credit risk relative to peers, and the cross-sell opportunity within its existing engaged user base remains substantial. With a large and fragmented addressable market, improving product attach rates, and a clear path toward GAAP profitability, our long-term thesis on Chime remains intact. We view the current weakness as a reflection of near-term sentiment rather than any fundamental deterioration in the business.
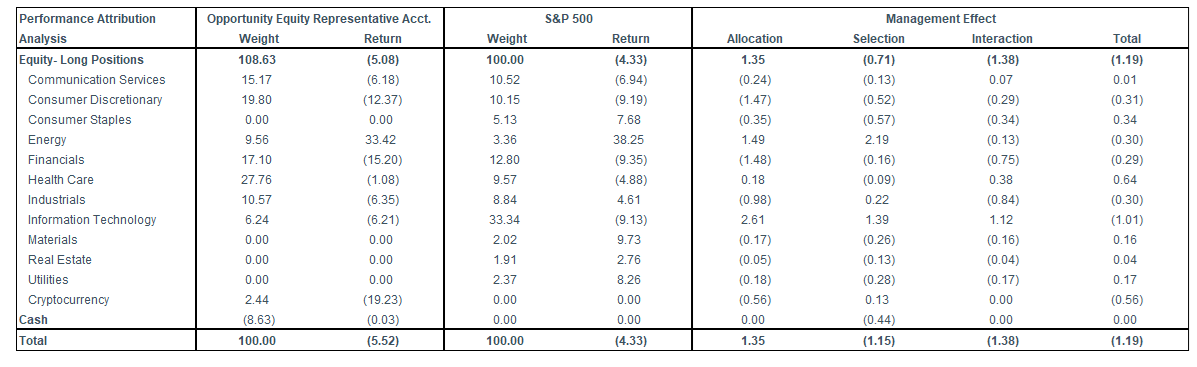
Performance Attribution is provided as a Portfolio Characteristic and is calculated on a gross basis. For the full strategy returns calculated on a gross and net basis, please refer to the full strategy performance presentation that follows the commentary.
Total portfolio return figures provided above reflect the sum of the returns of the holdings in the representative account portfolio due to price movements and dividend payments or other sources of income
Market Proxy is S&P 500. Returns greater than 1 year are annualized. Source: Bloomberg and Patient Capital Management.
The data provided is from APX and Patient Capital Management, LLC and is believed to be reliable, but is not guaranteed as to its timeliness or accuracy.
Percentages and returns may not sum to 100% due to rounding effects. A three-factor attribution consists of the allocation effect, selection effect, and the
interaction effect, which sum to the portfolio’s performance relative to the benchmark.
• Allocation. The allocation effect represents the portion of the portfolio’s excess return attributable to differences in sector weights between the portfolio and the benchmark index.
• Selection. The selection effect represents the portion of the portfolio’s excess return attributable to differences in the weights of individual securities within each sector between the portfolio and the benchmark index.
• Interaction. Most complex and sometimes counterintuitive, the interaction effect represents the portion of the portfolio’s excess return attributable to combining sector allocation decisions with security selection decisions, and is often thought of as measuring the accuracy of manager’s convictions. Please note that the methodology used by our independent third-party attribution software vendor will at times present sector allocation effects that are
counterintuitive. For example, the software may calculate a negative sector effect even when the portfolio, on a weighted average basis for the period,
overweight an outperforming sector. Under the vendor’s methodology, allocation effects in recent months may overwhelm the allocation effects from earlier in the period, particularly over longer time frames.
FOR INSTITUTIONAL INVESTORS ONLY
The S&P 500 Index (SPX) is a market capitalization-weighted index of 500 widely held common stocks. Investors cannot invest directly in an index and unmanaged index returns do not reflect any fees, expenses or sales charges. Earnings per share (EPS) is the portion of a company’s profit allocated to each outstanding share of common stock and serves as an indicator of a company’s profitability. Price to earnings is the market price per share divided by earnings per share. Active share is a measure of the percentage of stock holdings in a manager’s portfolio that differs from the benchmark index.
All historical financial information is unaudited and shall not be construed as a representation or warranty by us. References to indices and their respective performance data are not intended to imply that the Strategy’s objectives, strategies or investments were comparable to those of the indices in technique, composition or element of risk nor are they intended to imply that the fees or expense structures relating to the Strategy or its affiliates, were comparable to those of the indices; since the indices are unmanaged and cannot be invested in directly.
Earnings growth is not representative of the strategy’s future performance. FCF refers to Free Cash Flow and is earnings before depreciation, amortization, and non-cash charges minus maintenance capital expenditures. Earnings per share (EPS) is the portion of a company’s profit allocated to each outstanding share of common stock and serves as an indicator of a company’s profitability.
This information does not constitute, and should not be construed as, investment advice or recommendations with respect to the securities and sectors listed. All investments are subject to risk, including the possible loss of principal. There is no guarantee investment objectives will be met. Neither Patient Capital Management, LLC, nor its information providers are responsible for any damages or losses arising from any use of this information.
The Opportunity Equity composite performance figures reflected above include the deduction of a model investment management fee of 1% (the highest fee for separate accounts under our fee schedule), paid quarterly and certain other expenses. For important information about Opportunity Equity Strategy performance, please click on the Opportunity Equity Strategy Composite Performance Disclosure. Past performance is no guarantee of future results.
All holdings and portfolio data are reflective of a representative Opportunity Equity account.
Contributors detailed above represent the top five securities that contributed positively to performance during the quarter. Detractors detailed above represent the top five securities that detracted from performance during the quarter. Information detailed above is provided net of fees, includes cash, and is based on a representative Opportunity Equity account. Contribution listed above represents the period when the security was held during the quarter. For additional information on how Top Contributors and Top Detractors were determined and/or to obtain a list showing every holding’s contribution to the representative Opportunity Equity account performance contact us.
The information presented should not be considered a recommendation to purchase or sell any security and should not be relied upon as investment advice. It should not be assumed that any purchase or sale decisions will be profitable or will equal the performance of any security mentioned. References to specific securities are for illustrative purposes only. Portfolio composition is shown as of a point in time and is subject to change without notice.
The views expressed in this commentary reflect those of Patient Capital Management analyst(s) as of the date of the commentary. Any views are subject to change at any time based on market or other conditions, and Patient Capital Management disclaims any responsibility to update such views. The information presented should not be considered a recommendation to purchase or sell any security and should not be relied upon as investment advice. It should not be assumed that any purchase or sale decisions will be profitable or will equal the performance of any security mentioned. Past performance is no guarantee of future results.
Click for the Opportunity Equity Strategy Composite Performance Disclosure.
©2026 Patient Capital Management, LLC
| QTD | YTD | 1-Year | 3-Year | 5-Year | 10-Year | Since Inception (12/30/1999) | |
| Opportunity Equity (gross of fees) | -5.72% | -5.72% | 32.34% | 24.18% | 2.49% | 12.56% | 8.94% |
| Opportunity Equity (net of fees) | -5.96% | -5.96% | 31.05% | 22.96% | 1.47% | 11.45% | 7.87% |
| S&P 500 Index | -4.33% | -4.33% | 17.80% | 18.32% | 12.06% | 14.16% | 7.83% |
Share