Market Proxy is S&P 500. Returns greater than 1 year are annualized. Source: Bloomberg and Patient Capital Management
The data provided is from APX and Patient Capital Management, LLC and is believed to be reliable, but is not guaranteed as to its timeliness or accuracy. Percentages and returns may not sum to 100% due to rounding effects. A three-factor attribution consists of the allocation effect, selection effect, and the interaction effect, which sum to the portfolio's performance relative to the benchmark.
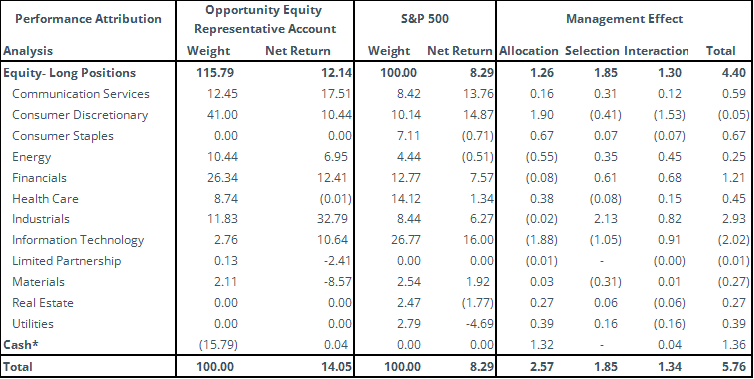
• Allocation. The allocation effect represents the portion of the portfolio's excess return attributable to differences in sector weights between the portfolio and the benchmark index.
• Selection. The selection effect represents the portion of the portfolio's excess return attributable to differences in the weights of individual securities within each sector between the portfolio and the benchmark index.
• Interaction. Most complex and sometimes counterintuitive, the interaction effect represents the portion of the portfolio’s excess return attributable to combining sector allocation decisions with security selection decisions, and is often thought of as measuring the accuracy of manager’s convictions.
Please note that the methodology used by our independent third-party attribution software vendor will at times present sector allocation effects that are counterintuitive. For example, the software may calculate a negative sector effect even when the portfolio, on a weighted average basis for the period, was overweight an outperforming sector. Under the vendor's methodology, allocation effects in recent months may overwhelm the allocation effects from earlier in the period, particularly over longer time frames.
Returns illustrated above are provided net of fees and include cash. Total portfolio return figures provided above reflect the sum of the returns of the holdings in the representative account portfolio due to price movements and dividend payments or other sources of income.
Fund Highlights
During the second quarter of 2023, Opportunity Equity strategy generated a total return of 13.31% net of fees. In comparison, the Fund’s unmanaged benchmark, the S&P 500 Index, returned 8.74%. The fund underperformed in April but rebounded in May and more than doubled the market’s performance in June.
Using a three-factor performance attribution model, allocation, selection, and interaction effects contributed to the portfolio’s outperformance. Norwegian Cruise Line Holdings (NCLH), Delta Air Lines (DAL), Meta Platforms Inc.(META), Amazon.com Inc.(AMZN) and Uber Technologies Inc.(UBER) were the largest contributors to performance, while Alibaba Group Holdings (BABA), Peloton Interactive (PTON), S4 Capital (SFOR LN), Teva PharmaceuticalS (TEVA) and Canada Goose Holdings (GOOS) were the largest detractors.
Relative to the index, the fund was overweight the Consumer Discretionary, Financials, Industrials, Communication Services, and Energy sectors on average during the quarter. With zero allocation to Real Estate, Consumer Staples and Utilities the fund was underweight in these sectors along with Information Technology, Materials and Healthcare sectors.
The portfolio added two positions and eliminated two positions during the quarter, ending the quarter with 40 holdings where the top 10 represented 48.0% of total assets compared to 30.5% for the index, highlighting the fund’s meaningful active share of around 105.8%.
Portfolio Review
Trends in the second quarter mimicked the first quarter with the top performing sectors remaining Information Technology, Consumer Discretionary and Telecommunications. The market broadened at the end of the quarter, helping our cyclical names outperform.
We believe our patience and investment flexibility are major strengths helping us outperform. Our process gives us conviction to invest in a diverse set of misvalued securities, and the patience to wait for the market to reflect the fundamentals. We use market volatility and dislocation to our advantage by adding exposure to undervalued names like IAC Inc (IAC), Western Alliance Bancorp (WAL) and Brilliant Earth (BRLT).
Patience helped us in travel names. In 2022, we made a big bet on names like Expedia Group Inc. (EXPE), Delta Air Lines Inc. (DAL), Norwegian Cruise Lines Holdings (NCLH), and United Airlines Holdings (UAL). We saw a divergence between strong and sustained demand with all-time low valuations. The decision paid off as all four were in the top 10 contributors for the quarter and top 15 year-to-date. Names that detracted the most last year have led the fund year-to-date as inflation came down and the Fed paused rate hikes. Names like Meta Platforms, Inc. (META), Amazon.com Inc. (AMZN), and Coinbase Global Inc. (COIN) lead as top 5 contributors year-to-date.
Energy tells the opposite story going from a top contributor last year to a top detractor this year. The stocks followed commodity prices lower as supply and demand dynamics remain balanced. Russian supply came in stronger than expectations, while demand growth has been muted. We still believe there is an attractive long-term opportunity in the energy space after years of underinvestment in supply. While current demand and supply appear balanced, this balance is fragile given potential geopolitical risk and natural disaster disruptions. While timing is unknown, estimates show the potential for undersupplied oil markets as early as the second half of 2023. We continue to like our holdings in the space with Energy Transfer (ET) benefitting from years of propriety pipeline build-outs in a capacity constrained environment. With a dividend yield of 9.5%, you are getting paid to be patient. Chesapeake Energy Corp (CHK) has 100% exposure to natural gas, a commodity that is well positioned from increased liquefied natural gas (LNG) demand from Europe. As the world moves to clean energy, natural gas will be the clean commodity of choice to bridge the gap. After emerging from bankruptcy with an improved balance sheet and new management team, we have confidence in the company’s disciplined capital allocation and shareholder return framework.
New and Eliminated
This quarter we entered three new positions, while exiting one position. Our largest new position is IAC Inc. (IAC) formerly known as IAC/InterActiveCorp, a holding company largely created by Barry Diller, who remains Chairman and Senior Executive. Joey Levin is currently CEO and has an excellent track record. Joining IAC in 2003 and working closely with Barry during his tenure, we have great confidence in his capital allocation process. IAC is often referred to as the anti-conglomerate as they buy and build up companies before sometimes spinning them off to shareholders. The company has generated significant shareholder value from spin-outs since 2000 while the company trades at a market cap of just $5.8B. We think this is an incredibly attractive valuation as the company’s publicly traded ownership stakes in Angi Inc. (ANGI) and MGM Resorts International (MGM) and its corporate cash balance alone account for 102% of the current market cap. This means there is no value currently being attributed to their private holdings vs the $4.1B in value ascribed to just the last four investments (Meredith, Vivian Health, Care.com, and Turo). Many of the private assets are household names. We think the company will continue to realize the hidden value in these assets by reinvigorating their business models and spinning them out to shareholders. We have confidence in the proven management team, their strategy and see long-term value at multiples of where the stock is currently trading.
Western Alliance Bancorp (WAL) was added in early-May following the renewed slide in midsized banks after the seizure of First Republic by regulators and the subsequent sale to JPMorgan Chase. This sparked fear of further contagion supported by PacWest Bancorp’s’ confirmation that it was in talks with potential investors and speculation in the Financial Times that Western was considering a potential sale. Despite the negative headlines, Western continued to grow deposits throughout the quarter, on track to hit its $2B target. The company has largely been swept up with the rest of the midsized banks, falling 77% peak to trough despite having better balance sheet growth, liquidity positioning and insured deposit levels. Even after the strong rebound since the lows, +103%, the company continues to trade below book value vs its historical average since going public in 2005 of 2.3x. The company is making progress on loan sales and expects to reach Common Equity Tier 1 (CET1) >10% by 2Q23 with insured deposits already reaching 80%. We think this is a case of the baby being thrown out with the bathwater, presenting the opportunity for investors to buy a superior midsized bank, with a 3.8% dividend yield that is continuing to be paid, while the company trades below book value. We think as fundamentals continue to improve, the price will follow.
We realized some losses by using ADT Inc (ADT) and Teva Pharmaceuticals (TEVA) as funding sources in the quarter.
Top Contributors and Top Detractors
| Top Contributors | Ticker | Net Contribution (bps) |
| Norwegian Cruise Line Holdings | NCLH | 210 |
| Delta Air Lines Inc. | DAL | 158 |
| Meta Platform Inc. | META | 158 |
| Amazon.com Inc. | AMZN | 151 |
| Uber Technologies Inc. | UBER | 128 |
| Top Contributors | Ticker | Net Contribution (bps) |
| Alibaba Group Holdings Ltd | BABA | -80 |
| Peloton Interactive Inc. | PTON | -60 |
| S4 Capital PLC | SFOR LN | -46 |
| Teva Pharmaceutical | TEVA | -46 |
| Canada Goose Holdings | GOOS | -29 |
*Contribution illustrated above are provided net of fees and includes cash.
Top Contributors
Norwegian Cruise Lines Holdings (NCLH) gained an impressive 61.9% ending the quarter as the second top performer in the S&P500 despite not taking off until mid-May. The new CEO, Harry Sommer, has refocused the company on data-driven decisions, prioritizing cost cuts and efficiency gains. The booking curve continues to be strong with 85% visibility into 2023 bookings and 25% into 2024 which is in-line with company targets of being booked 60-65% for the forward 12 months. Despite headlines of a weakening consumer, onboard spending continues to be strong and cancellation rates remain at their historical levels. The company continues to focus on deleveraging the balance sheet with positive free cash flow generation expected in 2024. While the travel rebound has been strong, we continue to believe that this trend will continue as services’ share of PCE still remains below pre-COVID levels, 66.5% vs 69% in 2019. Despite continued supply growth from new ships, demand remains strong while maintaining its traditional split of 1/3 new to cruise, 1/3 new to brand, and 1/3 repeat cruisers. We have confidence in the continued demand for travel and expect Norwegian to continue to benefit. We see the potential for EPS to grow at a compound annual growth rate (CAGR) of 40% from 2023-2027 due to continued normalization and growth of the fleet off a smaller base than competitors. As debt is paid down over time, value should continue to accrue to the equity holders.
Delta Air Lines Inc. (DAL) is another travel name that took off in mid-May gaining 39%. We see Delta as a premium global consumer brand that is materially misunderstood by the market. The market still sees airlines as a cyclical, bankruptcy prone industry. An improved supply-demand picture, management discipline and a much improved business mix make Delta a much more resilient business, in our view. Delta ranks as the fifth largest US e-commerce retailer behind Amazon, Apple, Walmart and eBay. The company has made a conscious decision to focus on the premium customer with all its supply growth going to this segment. Long-term their goal is to generate 37% of revenue from premium products up from the 35% they sit at today. Their loyalty program with American Express is a source of stable and growing revenues with $6.5B in remunerations this year with a goal of reaching $10B by the end of the contract in 2028. Premium and ancillary service revenue should generate 65-70% of the total in the next year or two. The company should continue to generate consistent mid-teens returns on capital. As the market begins to understand, we believe the company will continue to be rewarded. On top of this, free cash flow is expected to expand generating a cumulative ~$11B from ’23-’25, or 1/3rd of its current market cap. As the company pays down debt while growing the dividend, we think the stock will continue to trend higher.
Meta Platform Inc. (META) was a top contributor for the second quarter in a row gaining an additional 35%. While last quarter focused on improving efficiency, this quarter focused on reaccelerating topline growth supported by improved ad spend, engagement trends and the longer-term opportunity for generative AI. The company’s prior investments in AI/machine learning (ML )are paying off as recommendations and analytics tools are showing improved results. For example, daily revenue from Advantage Plus shopping campaigns were up 7x in the last 6 months and 20% of content seen is now recommended by AI, with recommendations driving a >24% increase in time spent on Instagram. While AI investments are a focus, the company continues to prioritize cost discipline, lowering the top end of its ’23 operating expenses (OpEx) guidance by $2b to $86-90B. The company completed $9B of buybacks (2% of shares) in the quarter with $42B remaining (8% of shares outstanding). Longer-term, the company called out the opportunity for generative AI as they look to introduce AI chat experiences via WhatsApp and Messenger and AI visual experiences via Facebook and Instagram. We have trimmed the position given the strong move year-to-date, but believe at 26x this year’s earnings, the valuation is not too demanding for a company with some of the best AI assets, an improving topline that should lead to free cash flow outperformance and room for significantly more cost discipline.
Top Detractors
Alibaba Group Holdings Limited (BABA) was a top detractor in the quarter falling 18% as the Chinese economy reopening was weaker than hoped. At the end of the first quarter, the company announced its intention to split itself into six main companies, a strategy which we believe will go a long way to unlocking value. Since then, the company has made progress on its restructuring with plans to spin-out AliCloud via a dividend to shareholders, to IPO Cainiao and Freshippo/Hema, and to raise external capital for International Digital Group all over the next 6-18 months. For the past year and a half, Alibaba traded at a significant discount to its sum-of-the-parts valuation. We think this discount will continue to decrease over time as the separation strategy makes progress and investors can value the individual businesses on a stand-alone basis. We also expect to see better operating performance of the individual companies as management can narrow their focus. At 11x earnings, we believe you are not paying much for a high-quality business. The setup reminds us of where out-of-favor US companies sat at the end of last year. We see potential for a similar rebound in Alibaba shares from here.
Peloton Interactive Inc. (PTON) reversed its strong rebound in the first quarter, declining 32%. Peloton is the posterchild of a pandemic beneficiary taking advantage of lockdowns to sell people exercise equipment they could use at home. The normalization process from this heightened level of demand continues to pressure the company and the question of total addressable market (TAM) continues to be raised. However, with the recent innovation in their go to market strategy we think the fears of a smaller TAM are overdone. At just 3.2M connected fitness subscribers, the company accounts for only 3.5% of total gym memberships in the countries in which they participate (US, UK, Germany, Australia). Furthermore, the company has evolved their thinking from being a gym replacement to being a gym supplement. We like the new management team led by Barry McCarthy, a longtime Netflix executive. The company has taken drastic action to right-size the extremely bloated cost structure, expand sales channels (Amazon, Dick’s Sporting Goods), roll-out a tiered membership structure and test other ways to reinvigorate growth. Peloton customers continue to be extremely loyal with monthly churn remaining at just above 1%, in-line with the wireless industry churn. Today, we see a very attractive risk/return skew with the ability to buy a brand leader in the market. We see attractive upside from here as the company continues to march towards profitability.
S4 Capital PLC (SFOR LN) continued its decline from its February peak, dropping 23% in the period. S4 is a digitally focused advertising business founded by Sir Martin Sorrell, previously CEO of WPP. We know Sir Martin well, and he’s a proven money-maker. The advertising industry continues to be pressured with the company seeing extended sales cycle. Despite these dynamics, organic growth is still expected to grow in the 8-12% range for the year. On a longer-term basis, there continues to be a large opportunity for market share expansion as the company currently represents only 0.8% of the $110B TAM for agency services. As a new model advertising agency, S4 Capital is 100% exposed to the secular shift to online digital advertising which management believes makes their business more resilient in a downturn. S4 sees AI as the third disruptive wave they have faced in the last 30 years after the Internet and smart phones. They believe they are best positioned to take advantage of the opportunity since they have been investing behind it since 2017, it’s already incorporated into their workflow and it’s easier to be nimble at only 9k employees. We think the risk/reward is extremely attractive for a business that is growing its top line at double digits while trading at a 2023 P/E of 10x in-line with legacy ad agencies that are only growing 4%.
Common Equity Tier 1 (CET1) is a component of Tier 1 capital that is primarily common stock held by a bank or other financial institution.
Personal consumption expenditures (PCE) includes a measure of consumer spending on goods and services among households in the US.
Total Addressable Market (TAM), also referred to as total available market, is the overall revenue opportunity that is available for a product or service if 100% market share is achieved.
Operating Expenses (OPEX): An operating expense is an expense that a business incurs through its normal business operations. Often abbreviated as OpEx, operating expenses include rent, equipment, inventory costs, marketing, payroll, insurance, step costs, and funds allocated for research and development.
This information does not constitute, and should not be construed as, investment advice or recommendations with respect to the securities and sectors listed. All investments are subject to risk, including the possible loss of principal. There is no guarantee investment objectives will be met. Neither Patient Capital Management, LLC, nor its information providers are responsible for any damages or losses arising from any use of this information.
The Opportunity Equity composite performance figures reflected above include the deduction of a model investment management fee of 1% (the highest fee for separate accounts under our fee schedule), paid quarterly and certain other expenses. For important information about Opportunity Equity Strategy performance, please click on the Opportunity Equity Strategy Composite Performance Disclosure. Past performance is no guarantee of future results.
All holdings and portfolio data are reflective of a representative Opportunity Equity account.
Performance in attribution table is not official strategy returns. The return is sourced from APX and is net of fees based on the strategy’s representative account.
Contributors detailed above represent the top five securities that contributed positively to performance during the quarter. Detractors detailed above
represent the top five securities that detracted from performance during the quarter. Information detailed above is provided net of fees, includes cash, and is based on a representative Opportunity Equity account. Contribution listed above represents the period when the security was held during the quarter. For additional information on how Top Contributors and Top Detractors were determined and/or to obtain a list showing every holding’s contribution to the representative Opportunity Equity account performance contact us.
The information presented should not be considered a recommendation to purchase or sell any security and should not be relied upon as investment advice. It should not be assumed that any purchase or sale decisions will be profitable or will equal the performance of any security mentioned. References to specific securities are for illustrative purposes only. Portfolio composition is shown as of a point in time and is subject to change without notice.
The views expressed in this commentary reflect those of Patient Capital Management analyst(s) as of the date of the commentary. Any views are subject to change at any time based on market or other conditions, and Patient Capital Management disclaims any responsibility to update such views. The information presented should not be considered a recommendation to purchase or sell any security and should not be relied upon as investment advice. It should not be assumed that any purchase or sale decisions will be profitable or will equal the performance of any security mentioned. Past performance is no guarantee of future results.
©2023 Patient Capital Management, LLC
Share