Strategy Highlights
During the second quarter of 2026, the Opportunity Equity Strategy generated a total return of 17.3% net of fees. In comparison, the Strategy's unmanaged benchmark, the S&P 500 Index, returned 15.2%.
Using a three-factor performance attribution model, interaction effects contributed to the portfolio’s outperformance, which was partially offset by both allocation and selection effects. UnitedHealth Group (UNH), Precigen Inc. (PGEN), CVS Health Corp (CVS), Citigroup Inc. (C), and Alphabet Inc. (GOOGL) were the largest contributors to performance, while Seadrill Limited (SDRL), QXO Inc. (QXO), Adobe Inc. (ADBE), Coinbase Global Inc. (COIN), and Adyen N.V. (ADYEN) were the largest detractors.
Relative to the index, the strategy was overweight the Health Care, Financials, Consumer Discretionary, Communication Services, Industrials, and Energy sectors on average during the quarter. With zero allocation to Consumer Staples, Materials, Utilities, and Real Estate, the portfolio was underweight these sectors along with Information Technology.
The portfolio entered five new positions, Adyen N.V. (ADYEN), Fidelity Wise Origin Bitcoin Fund (FBTC), Genius Sports Ltd. (GENI), Global Payments Inc. (GPN), and QXO, Inc. 4.75% Convertible Preferred (QXO), and exited three positions, iShares Bitcoin Trust ETF (IBIT), Dave & Buster's Entertainment Inc. (PLAY), and Noble Corporation plc (NE) during the quarter.
The portfolio ended the quarter with 38 holdings where the top 10 stocks represented 54.8% of total assets compared to 36.4% for the index, highlighting the strategy's meaningful active share of around 94.6%.
Portfolio Review
The end of the first quarter nearly marked the bottom for markets, with the S&P 500 gaining 15.2% in the second quarter, its strongest quarterly return since the second quarter of 2020. While much has been made of the AI trade, returns were far more dispersed beneath the surface. The Magnificent 7 lagged the broader market, returning 11.0% in the quarter, and as a group have underperformed the S&P 500 since December 2024. Meanwhile, semiconductor memory names such as SK Hynix, Micron, and Samsung climbed an average of 190%, supported by an extraordinary earnings recovery as demand surged and supply remained constrained.
Despite the impressive moves in several names we do not own, the strategy performed well as Health Care, a sector we built exposure to over the last few years, performed strongly. We often enter sectors before they become attractive to the broader market. While this can be a drag on near-term performance, we believe it is one of the things that sets us up well for long-term outperformance.
We entered UnitedHealth Group (UNH) and CVS Health (CVS) at different times, but for similar reasons. Both stocks sold off sharply as rising medical costs and broader execution challenges drove significant earnings revisions, with Medicare Advantage as a key source of weakness. We believed both companies had a clear path to improve underwriting margins as the industry raised prices and prioritized profitability over member growth. While we are early in the earnings recovery, both stocks have already seen sizable moves.
Precigen Inc. (PGEN) remains a compelling idiosyncratic biotech names. We led a PIPE investment in the company at the end of December 2024 because we believed the market was underappreciating both the near-term opportunity in its lead RRP (recurrent respiratory papilomatosis) drug and the value of its broader pipeline. Since then, the company has continued to execute, receiving its J-code in April, orphan exclusivity in May, and delivering a strong early launch curve in 2026. Despite the progress, we continue to believe the market is undervaluing the full potential of the RRP asset and the broader platform.
We also benefited from our ownership of Royalty Pharma plc (RPRX), Illumina Inc. (ILMN), and Biogen Inc. (BIIB). Royalty Pharma continues to compound through predictable royalty cash flows and an expanding opportunity set across biotech and large pharma. Illumina is beginning to show signs of normalized growth and profitability as its core sequencing business recovers from several years of disruption and is well positioned to capitalize on the innovation in multiomics. Biogen has a cleaner cost structure, a more focused pipeline, and an Alzheimer’s opportunity that we believe remains underappreciated.
When we initiated our positions, the common thread was the same: high-quality assets, depressed expectations, and fundamentals that we believed the market had yet to fully recognize.
We continue to look for the next area of undervalued opportunity, which has led us to build positions in several payments and fintech companies, including Adyen (ADYEN), Global Payments (GPN), and Chime Financial Inc. (CHYM), where we believe market expectations have become overly pessimistic relative to the long-term earnings power of the businesses.
New and Eliminated
This quarter we entered five new positions and exited three.
We continued to increase our exposure to the payments space during the quarter building positions in both Adyen N.V. (ADYEN) and Global Payments Inc. (GPN). Adyen is a leading next-generation global payments company with a unified technology stack built internally on a single platform. The company has steadily gained share, first in Europe and increasingly around the world. Historically viewed as a compounder, the stock declined amid concerns about rising competition and market share, leaving it trading at 16.4x 2027 earnings after adjusting for excess cash. We continue to view Adyen as a market leader and believe the negative sentiment has created an attractive opportunity to buy a long-term compounder early in its life cycle at a discounted valuation.
The same competitive concerns weighing on Adyen have also pressured Global Payments. The company is a legacy integrated payments processor built through acquisitions over the past two decades and, following its 2025 acquisition of Worldpay, is now one of the world’s largest merchant acquirers. Despite its legacy positioning, we believe the competitive risks are overstated. The payments industry remains highly fragmented, with a long tail of legacy businesses proving surprisingly sticky. We believe the market is overly pessimistic about the company’s prospects. Global Payments trades at just 6.0x 2027 earnings with a free cash flow yield of 13%. While the market continues to debate its future, the company offers a 1.3% dividend yield and continues to repurchase shares, reducing shares outstanding by 5.2% in the first half of the year.
We replaced our iShares Bitcoin Trust ETF (IBIT) position with the Fidelity Wise Origin Bitcoin Fund (FBTC), maintaining our long-term Bitcoin exposure in the strategy. Our long-term thesis remains unchanged. We continue to view Bitcoin as an early digital gold with a hard supply cap of 21 million coins and growing institutional adoption that creates a durable and expanding demand base. Today, Bitcoin sits at a market cap of only $1.3T compared to gold’s $28.6T market value.
We initiated a small position in Genius Sports Ltd. (GENI), a sports data and technology company that holds exclusive data rights from major sports leagues, including the NFL. The company plays a critical role connecting leagues with the legal sports-betting ecosystem, which continues to expand globally. Its position in the value chain provides relatively stable earnings, historically supporting a premium valuation. Genius is also expanding beyond sportsbooks into the broader prediction-market ecosystem through partnerships with companies such as Kalshi, while building its AdTech business by capitalizing on the secular shift in advertising budgets toward sports and leveraging its differentiated first-party data. We find the secular growth opportunity attractive, particularly with the stock trading at just 15x next year’s earnings.
We entered into another PIPE (private investment in publicly traded entity) transaction with QXO Inc. (QXO) in January 2026. The commitment took the form of convertible preferred securities carrying a 4.75% dividend and a conversion price of $23.25, which QXO could draw within one year if it identified an appropriate acquisition. The company called the first tranche in April to help fund its $2.25 billion acquisition of privately held Kodiak and the remaining tranche in July to support its $17 billion acquisition of TopBuild Corp. (BLD). We continue to view QXO as an attractive investment led by serial entrepreneur Brad Jacobs, who is applying the same playbook he successfully used at previous companies. His strong track record and credibility with investors allow QXO to raise capital on attractive terms, providing a competitive advantage over peers. We believe the company is well positioned to become a long-term compounder as it consolidates the highly fragmented building-products industry.
We exited Noble Corporation plc (NE) after a strong first quarter in which the stock gained 75.7% following the beginning of the Iran War and the closure of the Strait of Hormuz. We exited Dave & Buster's Entertainment Inc. (PLAY) to invest in other names with more attractive risk-return.
Top Contributors & Top Detractors
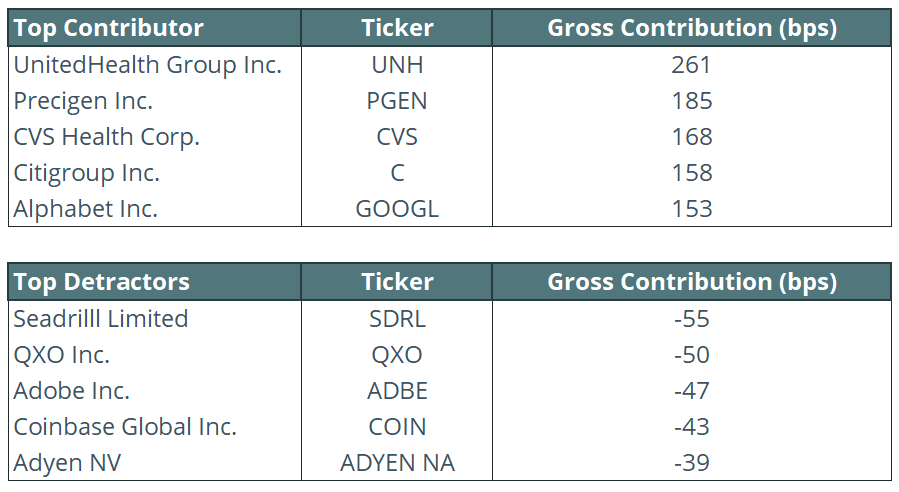
*Contribution and returns provided above are presented gross of fees and includes cash. For full performance of the strategy, please refer to the full performance information that follows the commentary below.
Top Contributors
UnitedHealth Group (UNH) and CVS Health Corp (CVS) were top contributors in the second quarter, gaining an impressive 54.4% and 45.2%, respectively, and reversing much of the pressure seen in the first quarter after CMS proposed a near-flat 0.09% Medicare Advantage reimbursement increase for 2027. As we wrote last quarter, we viewed the selloff as an opportunity and increased our exposure, a decision that paid off when CMS finalized a 2.48% payment-rate increase, helping both stocks recover. Since then, both companies have posted better than expected earnings, beating consensus estimates and raising full year guidance.
We continue to view UnitedHealth as a category leader, with a uniquely integrated platform spanning health benefits, pharmacy benefit management, and health services through Optum Health, Optum Rx, and Optum Insight. In our view, its long-term earnings power and competitive position remain intact. We expect earnings to grow in the teens. The stock sports a 2.2% dividend yield with a consistent buyback program. We also continue to view CVS as an attractive collection of healthcare assets, including Aetna, Caremark, Signify Health, and Oak Street Health, which together position the company to benefit from the industry’s transition toward value-based care. With new leadership in place, a roughly 2.6% dividend yield, and trough earnings likely behind it, we continue to see attractive prospects ahead.
Precigen Inc. (PGEN) was a top contributor in the second quarter. As long-time followers of this name know, we led a PIPE transaction in December 2024 that gave us exposure through convertible perpetual preferreds (since converted to common) and warrants ahead of the company's pivotal FDA approval. In August 2025, Papziemos became the first-in-class, off-the-shelf immunotherapy approved for recurrent respiratory papillomatosis, a patient population with no prior treatment options. Since approval, the company has been off to the races. In April, it received its J-code, a critical milestone that enables reimbursement through standard billing pathways, and in May, it received Orphan Drug Designation, providing seven years of exclusivity. Together with a strong launch, the company expects to reach a self-funding inflection point by year end. With a market cap of only $2 billion, we believe the market continues to miss the attractive opportunity here. At today's valuation, the company trades below the value of Papziemos alone, let alone the rest of its pipeline, which continues to advance into pivotal trials. In the short term, we see an attractive setup, as current consensus revenue estimates underappreciate the strong launch curve we have seen year to date. As the company continues to deliver, we expect the market to take notice.
Top Detractors
Seadrill Limited (SDRL) was the largest detractor in the second quarter, declining 16.9% after gaining 31.5% in the first quarter. The reversal reflected the broader pullback in energy prices during the quarter, as the U.S. reached an interim agreement with Iran that allowed for the reopening of the Strait of Hormuz. As tanker traffic resumed, market concerns quickly shifted from undersupply to oversupply, pushing prices lower. Seadrill is the third-largest independent offshore driller and has a clean balance sheet following its emergence from bankruptcy in 2022. We continue to view the offshore drilling market as attractive over the long term, particularly as growth in land-based oil production slows. Industry dynamics have improved meaningfully since 2019, with significant consolidation reducing the number of major players to just three. At the same time, nearly half of all deepwater rigs have been scrapped over the past decade, and with limited current capital investment, supply growth is likely to remain constrained for years. We believe Seadrill is well positioned to benefit as contract rates normalize higher and offshore drilling plays an increasingly important role in global energy security. The company could also play a meaningful role in further industry consolidation, either as an acquirer or as an attractive strategic target.
QXO Inc. (QXO) was a top detractor in the second quarter, declining 10.9%. We first initiated a position through a PIPE transaction in mid-2024 and have continued to participate in subsequent capital raises, as we believe the market continues to underappreciate the company’s long-term return potential. Led by Brad Jacobs, QXO is pursuing a proven roll-up strategy in the highly fragmented building-products distribution industry. Jacobs’ track record of creating value through consolidation across waste management, equipment rental, and logistics speaks for itself. Since launching the strategy, QXO has completed three acquisitions: Beacon Roofing Supply, Kodiak Building Partners, and TopBuild. While near-term construction activity remains under pressure, our conviction in the long-term value-creation opportunity remains intact. Over the next decade, QXO is targeting more than $50 billion in annual revenue, compared with an expected $13.5 billion this year. We continue to view pullbacks as attractive opportunities to add to our position.
Adobe Inc. (ADBE) was a top detractor in the second quarter, declining 15.1%. We initiated a position last quarter as the stock was caught in the “SaaS-pocalypse” trade, but our entry proved early. As value investors, we often invest before sentiment turns; having already done the work and knowing the business well, we used the second-quarter pullback to increase our position. Adobe is the dominant platform for creative professionals, with leading positions across document management, digital design, and marketing software. The stock has been pressured by concerns that AI could disrupt its core creative tools business, but we believe these fears are overblown and that the bar for attractive upside remains low. Document Cloud and Experience Cloud provide durable, high-margin recurring revenue streams with limited disruption risk, while Adobe continues to integrate and monetize AI through its Firefly platform. Meanwhile, the company continues to generate significant free cash flow, trades at a 12% free cash flow yield, and has repurchased a net 18% of shares outstanding over the past five years.
During the second quarter of 2026, the Opportunity Equity Strategy generated a total return of 17.3% net of fees. In comparison, the Strategy's unmanaged benchmark, the S&P 500 Index, returned 15.2%.
Using a three-factor performance attribution model, interaction effects contributed to the portfolio’s outperformance, which was partially offset by both allocation and selection effects. UnitedHealth Group (UNH), Precigen Inc. (PGEN), CVS Health Corp (CVS), Citigroup Inc. (C), and Alphabet Inc. (GOOGL) were the largest contributors to performance, while Seadrill Limited (SDRL), QXO Inc. (QXO), Adobe Inc. (ADBE), Coinbase Global Inc. (COIN), and Adyen N.V. (ADYEN) were the largest detractors.
Relative to the index, the strategy was overweight the Health Care, Financials, Consumer Discretionary, Communication Services, Industrials, and Energy sectors on average during the quarter. With zero allocation to Consumer Staples, Materials, Utilities, and Real Estate, the portfolio was underweight these sectors along with Information Technology.
The portfolio entered five new positions, Adyen N.V. (ADYEN), Fidelity Wise Origin Bitcoin Fund (FBTC), Genius Sports Ltd. (GENI), Global Payments Inc. (GPN), and QXO, Inc. 4.75% Convertible Preferred (QXO), and exited three positions, iShares Bitcoin Trust ETF (IBIT), Dave & Buster's Entertainment Inc. (PLAY), and Noble Corporation plc (NE) during the quarter.
The portfolio ended the quarter with 38 holdings where the top 10 stocks represented 54.8% of total assets compared to 36.4% for the index, highlighting the strategy's meaningful active share of around 94.6%.
Portfolio Review
The end of the first quarter nearly marked the bottom for markets, with the S&P 500 gaining 15.2% in the second quarter, its strongest quarterly return since the second quarter of 2020. While much has been made of the AI trade, returns were far more dispersed beneath the surface. The Magnificent 7 lagged the broader market, returning 11.0% in the quarter, and as a group have underperformed the S&P 500 since December 2024. Meanwhile, semiconductor memory names such as SK Hynix, Micron, and Samsung climbed an average of 190%, supported by an extraordinary earnings recovery as demand surged and supply remained constrained.
Despite the impressive moves in several names we do not own, the strategy performed well as Health Care, a sector we built exposure to over the last few years, performed strongly. We often enter sectors before they become attractive to the broader market. While this can be a drag on near-term performance, we believe it is one of the things that sets us up well for long-term outperformance.
We entered UnitedHealth Group (UNH) and CVS Health (CVS) at different times, but for similar reasons. Both stocks sold off sharply as rising medical costs and broader execution challenges drove significant earnings revisions, with Medicare Advantage as a key source of weakness. We believed both companies had a clear path to improve underwriting margins as the industry raised prices and prioritized profitability over member growth. While we are early in the earnings recovery, both stocks have already seen sizable moves.
Precigen Inc. (PGEN) remains a compelling idiosyncratic biotech names. We led a PIPE investment in the company at the end of December 2024 because we believed the market was underappreciating both the near-term opportunity in its lead RRP (recurrent respiratory papilomatosis) drug and the value of its broader pipeline. Since then, the company has continued to execute, receiving its J-code in April, orphan exclusivity in May, and delivering a strong early launch curve in 2026. Despite the progress, we continue to believe the market is undervaluing the full potential of the RRP asset and the broader platform.
We also benefited from our ownership of Royalty Pharma plc (RPRX), Illumina Inc. (ILMN), and Biogen Inc. (BIIB). Royalty Pharma continues to compound through predictable royalty cash flows and an expanding opportunity set across biotech and large pharma. Illumina is beginning to show signs of normalized growth and profitability as its core sequencing business recovers from several years of disruption and is well positioned to capitalize on the innovation in multiomics. Biogen has a cleaner cost structure, a more focused pipeline, and an Alzheimer’s opportunity that we believe remains underappreciated.
When we initiated our positions, the common thread was the same: high-quality assets, depressed expectations, and fundamentals that we believed the market had yet to fully recognize.
We continue to look for the next area of undervalued opportunity, which has led us to build positions in several payments and fintech companies, including Adyen (ADYEN), Global Payments (GPN), and Chime Financial Inc. (CHYM), where we believe market expectations have become overly pessimistic relative to the long-term earnings power of the businesses.
New and Eliminated
This quarter we entered five new positions and exited three.
We continued to increase our exposure to the payments space during the quarter building positions in both Adyen N.V. (ADYEN) and Global Payments Inc. (GPN). Adyen is a leading next-generation global payments company with a unified technology stack built internally on a single platform. The company has steadily gained share, first in Europe and increasingly around the world. Historically viewed as a compounder, the stock declined amid concerns about rising competition and market share, leaving it trading at 16.4x 2027 earnings after adjusting for excess cash. We continue to view Adyen as a market leader and believe the negative sentiment has created an attractive opportunity to buy a long-term compounder early in its life cycle at a discounted valuation.
The same competitive concerns weighing on Adyen have also pressured Global Payments. The company is a legacy integrated payments processor built through acquisitions over the past two decades and, following its 2025 acquisition of Worldpay, is now one of the world’s largest merchant acquirers. Despite its legacy positioning, we believe the competitive risks are overstated. The payments industry remains highly fragmented, with a long tail of legacy businesses proving surprisingly sticky. We believe the market is overly pessimistic about the company’s prospects. Global Payments trades at just 6.0x 2027 earnings with a free cash flow yield of 13%. While the market continues to debate its future, the company offers a 1.3% dividend yield and continues to repurchase shares, reducing shares outstanding by 5.2% in the first half of the year.
We replaced our iShares Bitcoin Trust ETF (IBIT) position with the Fidelity Wise Origin Bitcoin Fund (FBTC), maintaining our long-term Bitcoin exposure in the strategy. Our long-term thesis remains unchanged. We continue to view Bitcoin as an early digital gold with a hard supply cap of 21 million coins and growing institutional adoption that creates a durable and expanding demand base. Today, Bitcoin sits at a market cap of only $1.3T compared to gold’s $28.6T market value.
We initiated a small position in Genius Sports Ltd. (GENI), a sports data and technology company that holds exclusive data rights from major sports leagues, including the NFL. The company plays a critical role connecting leagues with the legal sports-betting ecosystem, which continues to expand globally. Its position in the value chain provides relatively stable earnings, historically supporting a premium valuation. Genius is also expanding beyond sportsbooks into the broader prediction-market ecosystem through partnerships with companies such as Kalshi, while building its AdTech business by capitalizing on the secular shift in advertising budgets toward sports and leveraging its differentiated first-party data. We find the secular growth opportunity attractive, particularly with the stock trading at just 15x next year’s earnings.
We entered into another PIPE (private investment in publicly traded entity) transaction with QXO Inc. (QXO) in January 2026. The commitment took the form of convertible preferred securities carrying a 4.75% dividend and a conversion price of $23.25, which QXO could draw within one year if it identified an appropriate acquisition. The company called the first tranche in April to help fund its $2.25 billion acquisition of privately held Kodiak and the remaining tranche in July to support its $17 billion acquisition of TopBuild Corp. (BLD). We continue to view QXO as an attractive investment led by serial entrepreneur Brad Jacobs, who is applying the same playbook he successfully used at previous companies. His strong track record and credibility with investors allow QXO to raise capital on attractive terms, providing a competitive advantage over peers. We believe the company is well positioned to become a long-term compounder as it consolidates the highly fragmented building-products industry.
We exited Noble Corporation plc (NE) after a strong first quarter in which the stock gained 75.7% following the beginning of the Iran War and the closure of the Strait of Hormuz. We exited Dave & Buster's Entertainment Inc. (PLAY) to invest in other names with more attractive risk-return.
Top Contributors & Top Detractors
*Contribution and returns provided above are presented gross of fees and includes cash. For full performance of the strategy, please refer to the full performance information that follows the commentary below.
Top Contributors
UnitedHealth Group (UNH) and CVS Health Corp (CVS) were top contributors in the second quarter, gaining an impressive 54.4% and 45.2%, respectively, and reversing much of the pressure seen in the first quarter after CMS proposed a near-flat 0.09% Medicare Advantage reimbursement increase for 2027. As we wrote last quarter, we viewed the selloff as an opportunity and increased our exposure, a decision that paid off when CMS finalized a 2.48% payment-rate increase, helping both stocks recover. Since then, both companies have posted better than expected earnings, beating consensus estimates and raising full year guidance.
We continue to view UnitedHealth as a category leader, with a uniquely integrated platform spanning health benefits, pharmacy benefit management, and health services through Optum Health, Optum Rx, and Optum Insight. In our view, its long-term earnings power and competitive position remain intact. We expect earnings to grow in the teens. The stock sports a 2.2% dividend yield with a consistent buyback program. We also continue to view CVS as an attractive collection of healthcare assets, including Aetna, Caremark, Signify Health, and Oak Street Health, which together position the company to benefit from the industry’s transition toward value-based care. With new leadership in place, a roughly 2.6% dividend yield, and trough earnings likely behind it, we continue to see attractive prospects ahead.
Precigen Inc. (PGEN) was a top contributor in the second quarter. As long-time followers of this name know, we led a PIPE transaction in December 2024 that gave us exposure through convertible perpetual preferreds (since converted to common) and warrants ahead of the company's pivotal FDA approval. In August 2025, Papziemos became the first-in-class, off-the-shelf immunotherapy approved for recurrent respiratory papillomatosis, a patient population with no prior treatment options. Since approval, the company has been off to the races. In April, it received its J-code, a critical milestone that enables reimbursement through standard billing pathways, and in May, it received Orphan Drug Designation, providing seven years of exclusivity. Together with a strong launch, the company expects to reach a self-funding inflection point by year end. With a market cap of only $2 billion, we believe the market continues to miss the attractive opportunity here. At today's valuation, the company trades below the value of Papziemos alone, let alone the rest of its pipeline, which continues to advance into pivotal trials. In the short term, we see an attractive setup, as current consensus revenue estimates underappreciate the strong launch curve we have seen year to date. As the company continues to deliver, we expect the market to take notice.
Top Detractors
Seadrill Limited (SDRL) was the largest detractor in the second quarter, declining 16.9% after gaining 31.5% in the first quarter. The reversal reflected the broader pullback in energy prices during the quarter, as the U.S. reached an interim agreement with Iran that allowed for the reopening of the Strait of Hormuz. As tanker traffic resumed, market concerns quickly shifted from undersupply to oversupply, pushing prices lower. Seadrill is the third-largest independent offshore driller and has a clean balance sheet following its emergence from bankruptcy in 2022. We continue to view the offshore drilling market as attractive over the long term, particularly as growth in land-based oil production slows. Industry dynamics have improved meaningfully since 2019, with significant consolidation reducing the number of major players to just three. At the same time, nearly half of all deepwater rigs have been scrapped over the past decade, and with limited current capital investment, supply growth is likely to remain constrained for years. We believe Seadrill is well positioned to benefit as contract rates normalize higher and offshore drilling plays an increasingly important role in global energy security. The company could also play a meaningful role in further industry consolidation, either as an acquirer or as an attractive strategic target.
QXO Inc. (QXO) was a top detractor in the second quarter, declining 10.9%. We first initiated a position through a PIPE transaction in mid-2024 and have continued to participate in subsequent capital raises, as we believe the market continues to underappreciate the company’s long-term return potential. Led by Brad Jacobs, QXO is pursuing a proven roll-up strategy in the highly fragmented building-products distribution industry. Jacobs’ track record of creating value through consolidation across waste management, equipment rental, and logistics speaks for itself. Since launching the strategy, QXO has completed three acquisitions: Beacon Roofing Supply, Kodiak Building Partners, and TopBuild. While near-term construction activity remains under pressure, our conviction in the long-term value-creation opportunity remains intact. Over the next decade, QXO is targeting more than $50 billion in annual revenue, compared with an expected $13.5 billion this year. We continue to view pullbacks as attractive opportunities to add to our position.
Adobe Inc. (ADBE) was a top detractor in the second quarter, declining 15.1%. We initiated a position last quarter as the stock was caught in the “SaaS-pocalypse” trade, but our entry proved early. As value investors, we often invest before sentiment turns; having already done the work and knowing the business well, we used the second-quarter pullback to increase our position. Adobe is the dominant platform for creative professionals, with leading positions across document management, digital design, and marketing software. The stock has been pressured by concerns that AI could disrupt its core creative tools business, but we believe these fears are overblown and that the bar for attractive upside remains low. Document Cloud and Experience Cloud provide durable, high-margin recurring revenue streams with limited disruption risk, while Adobe continues to integrate and monetize AI through its Firefly platform. Meanwhile, the company continues to generate significant free cash flow, trades at a 12% free cash flow yield, and has repurchased a net 18% of shares outstanding over the past five years.
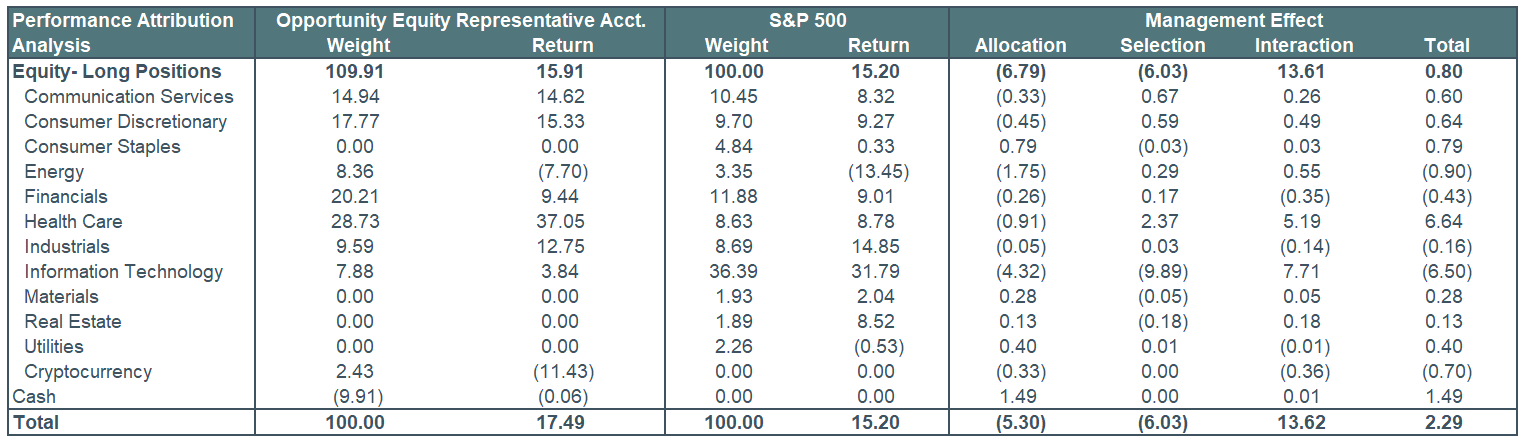
Performance Attribution is provided as a Portfolio Characteristic and is calculated on a gross basis. For the full strategy returns calculated on a gross and net basis, please refer to the full strategy performance presentation that follows the commentary.
Total portfolio return figures provided above reflect the sum of the returns of the holdings in the representative account portfolio due to price movements and dividend payments or other sources of income
Market Proxy is S&P 500. Returns greater than 1 year are annualized. Source: Bloomberg and Patient Capital Management.
The data provided is from APX and Patient Capital Management, LLC and is believed to be reliable, but is not guaranteed as to its timeliness or accuracy.
Percentages and returns may not sum to 100% due to rounding effects. A three-factor attribution consists of the allocation effect, selection effect, and the
interaction effect, which sum to the portfolio’s performance relative to the benchmark.
• Allocation. The allocation effect represents the portion of the portfolio’s excess return attributable to differences in sector weights between the portfolio and the benchmark index.
• Selection. The selection effect represents the portion of the portfolio’s excess return attributable to differences in the weights of individual securities within each sector between the portfolio and the benchmark index.
• Interaction. Most complex and sometimes counterintuitive, the interaction effect represents the portion of the portfolio’s excess return attributable to combining sector allocation decisions with security selection decisions, and is often thought of as measuring the accuracy of manager’s convictions. Please note that the methodology used by our independent third-party attribution software vendor will at times present sector allocation effects that are
counterintuitive. For example, the software may calculate a negative sector effect even when the portfolio, on a weighted average basis for the period,
overweight an outperforming sector. Under the vendor’s methodology, allocation effects in recent months may overwhelm the allocation effects from earlier in the period, particularly over longer time frames.
FOR INSTITUTIONAL INVESTORS ONLY
The S&P 500 Index (SPX) is a market capitalization-weighted index of 500 widely held common stocks. Investors cannot invest directly in an index and unmanaged index returns do not reflect any fees, expenses or sales charges. Earnings per share (EPS) is the portion of a company’s profit allocated to each outstanding share of common stock and serves as an indicator of a company’s profitability. Price to earnings is the market price per share divided by earnings per share. Active share is a measure of the percentage of stock holdings in a manager’s portfolio that differs from the benchmark index.
All historical financial information is unaudited and shall not be construed as a representation or warranty by us. References to indices and their respective performance data are not intended to imply that the Strategy’s objectives, strategies or investments were comparable to those of the indices in technique, composition or element of risk nor are they intended to imply that the fees or expense structures relating to the Strategy or its affiliates, were comparable to those of the indices; since the indices are unmanaged and cannot be invested in directly.
Earnings growth is not representative of the strategy’s future performance. FCF refers to Free Cash Flow and is earnings before depreciation, amortization, and non-cash charges minus maintenance capital expenditures. Earnings per share (EPS) is the portion of a company’s profit allocated to each outstanding share of common stock and serves as an indicator of a company’s profitability.
This information does not constitute, and should not be construed as, investment advice or recommendations with respect to the securities and sectors listed. All investments are subject to risk, including the possible loss of principal. There is no guarantee investment objectives will be met. Neither Patient Capital Management, LLC, nor its information providers are responsible for any damages or losses arising from any use of this information.
The Opportunity Equity composite performance figures reflected above include the deduction of a model investment management fee of 1% (the highest fee for separate accounts under our fee schedule), paid quarterly and certain other expenses. For important information about Opportunity Equity Strategy performance, please click on the Opportunity Equity Strategy Composite Performance Disclosure. Past performance is no guarantee of future results.
All holdings and portfolio data are reflective of a representative Opportunity Equity account.
Contributors detailed above represent the top five securities that contributed positively to performance during the quarter. Detractors detailed above represent the top five securities that detracted from performance during the quarter. Information detailed above is provided net of fees, includes cash, and is based on a representative Opportunity Equity account. Contribution listed above represents the period when the security was held during the quarter. For additional information on how Top Contributors and Top Detractors were determined and/or to obtain a list showing every holding’s contribution to the representative Opportunity Equity account performance contact us.
The information presented should not be considered a recommendation to purchase or sell any security and should not be relied upon as investment advice. It should not be assumed that any purchase or sale decisions will be profitable or will equal the performance of any security mentioned. References to specific securities are for illustrative purposes only. Portfolio composition is shown as of a point in time and is subject to change without notice.
The views expressed in this commentary reflect those of Patient Capital Management analyst(s) as of the date of the commentary. Any views are subject to change at any time based on market or other conditions, and Patient Capital Management disclaims any responsibility to update such views. The information presented should not be considered a recommendation to purchase or sell any security and should not be relied upon as investment advice. It should not be assumed that any purchase or sale decisions will be profitable or will equal the performance of any security mentioned. Past performance is no guarantee of future results.
| QTD | YTD | 1-Year | 3-Year | 5-Year | 10-Year | Since Inception (12/30/1999) | |
| Opportunity Equity (gross of fees) | 17.6% | 11.0% | 35.9% | 27.0% | 6.0% | 16.2% | 9.8% |
| Opportunity Equity (net of fees) | 17.3% | 10.4% | 34.5% | 25.7% | 5.0% | 15.0% | 8.7% |
| S&P 500 Index | 15.2% | 10.4% | 22.3% | 20.6% | 13.4% | 15.5% | 8.3% |
| S&P 500 Value Index | 8.0% | 8.0% | 18.4% | 14.4% | 11.3% | 11.9% | 7.4% |
Refer to the full disclosure below for important additional information. The returns are for the Opportunity Equity Strategy which includes accounts that have utilized derivatives and leverage. Derivatives and leverage will not be used in this program and this different could materially impact performance.
Click for the Opportunity Equity Strategy Composite Performance Disclosure.
©2026 Patient Capital Management, LLC
Click for the Opportunity Equity Strategy Composite Performance Disclosure.
©2026 Patient Capital Management, LLC
Share