Strategy Highlights
During the third quarter of 2026, the Opportunity Equity Strategy generated a total return of 4.32% net of fees. In comparison, the Strategy's unmanaged benchmark, the S&P 500 Index, returned 2.30%.
Using a three-factor performance attribution model, allocation, selection, and interaction effects contributed to the portfolio’s outperformance. Precigen Inc. Warrants, Precigen Inc. (PGEN), Meta Platforms Inc. (META), Fidelity Wise Origin Bitcoin Fund (FBTC), and Meta Platforms Call Options (C540 1/21/28) were the largest contributors to performance, while QXO Inc. (QXO), Norwegian Cruise Line Holdings Ltd. (NCLH), UnitedHealth Group (UNH), United Airlines Holdings Inc. (UAL), and CVS Health Corp (CVS) were the largest detractors.
Relative to the index, the Strategy was overweight the Health Care, Financials, Consumer Discretionary, Communication Services, and Energy sectors on average during the quarter and in line with the index in Industrials. With zero allocation to Consumer Staples, Materials, Utilities, and Real Estate, the portfolio was underweight these sectors along with Information Technology.
The portfolio entered three new positions, Broadcom Inc. (AVGO), Meta Platforms Call Options (C600 9/17/27), and Meta Platforms Call Options (C540 1/21/28), and exited four positions, Genius Sports Ltd. (GENI), Illumina Inc. (ILMN), JD.com Inc. (JD), and Meta Platforms Call Options (C600 9/17/27) during the quarter.
The portfolio ended the quarter with 37 holdings where the top 10 stocks represented 55.3% of total assets compared to 39.1% for the index, highlighting the Strategy's meaningful active share of around 91.6%.
Portfolio Review
The Strategy continued to perform well in the third quarter, generating a total return of 4.32% net of fees. The broader market also advanced, with the S&P 500 gaining 2.30% and reaching new all-time highs during the period. Despite the headline gains, market breadth narrowed, with the S&P 500 Equal Weight Index declining 1.90% as large-caps regained leadership. Within technology, software rebounded from losses earlier in the year and outperformed semiconductors. Single stock volatility has remained high, which suits our investment style as we focus on buying businesses that are out of favor when we believe the market has become overly negative. We invest for the long term and do not expect positions to work immediately, but several stocks we purchased following sharp declines earlier in the year have begun to show traction.
Adobe Inc. (ADBE), a name we entered during the “SaaS apocalypse,” started to recover from its lows. While AI concerns continue to weigh on the narrative, the company has now delivered two consecutive quarters of revenue and EPS beats while raising full-year guidance. The market will likely continue to question the durability of the business, but we believe Adobe is taking the right steps to integrate and monetize AI through its Firefly platform, and elsewhere. Despite the headlines, the company continues to generate significant free cash flow, trades at a 12% free cash flow yield, and has repurchased a net 18% of shares outstanding over the past five years.
Payments names, which we called out last quarter as attractive new opportunities, also performed well. Chime Financial Inc. (CHYM) gained 30%, Global Payments Inc. (GPN) gained 13%, and Adyen NV (ADYEN) gained 6%. We continue to see material upside in all three as the companies execute.
We view Chime as being in the early stages of what Nick Sleep referred to as “scaled economies shared.” As the low-cost provider serving a customer base that is often uneconomic for traditional competitors, Chime has carved out a niche position in an attractive market. Over time, we believe the company can continue to reinvest its scale advantages into new products, better pricing, and a broader customer relationship.
Global Payments is a classic example of the market becoming overly pessimistic on a legacy provider without fully appreciating how sticky the business remains. The company trades at just 5x 2027 EPS with a 17% free cash flow yield, while continuing to return capital to shareholders through buybacks and dividends.
Adyen was once a market darling and is slowly working to regain that reputation. It remains one of the leading next-generation global payments companies, yet trades at just 16.6x 2027 earnings after adjusting for excess cash despite having sustained growth in the 20% range.
More broadly, the quarter was a reminder that when expectations are low, companies do not need everything to go right for the stocks to work. They simply need results to hold up and the narrative to stop getting worse. We continue to see a number of these opportunities across the portfolio.
New and Eliminated
This quarter we entered three new positions and exited four.
We entered a position in Broadcom Inc. (AVGO) during the quarter, a leading semiconductor and infrastructure software company. Despite being one of the clearest beneficiaries of AI infrastructure spending, the stock has lagged the broader AI trade as investors focused on customer concentration, competition, and the durability of custom silicon demand. We believe those concerns are creating an attractive entry point. Broadcom is uniquely positioned across two important AI infrastructure bottlenecks: custom accelerators and high-performance networking. Hyperscalers are increasingly using purpose-built chips to lower the cost and power consumption of large-scale AI workloads, and Broadcom is one of the few companies capable of supporting that transition at scale. Under CEO Hock Tan, Broadcom has built an exceptional track record of disciplined capital allocation, operational execution, and shareholder returns. Management now expects AI semiconductor revenue to reach roughly $58 billion in fiscal 2026 and has guided for that revenue to roughly double in both fiscal 2027 and fiscal 2028, reaching approximately $230 billion and representing nearly 100% year-over-year growth in each year. At the same time, Broadcom’s high-margin software business provides stability and significant free cash flow. Today, the company trades roughly in line with the market at ~20x forward earnings while growing earnings at more than 4.5x the market rate. With strong free cash flow generation, high incremental returns, and a consistent history of returning cash to shareholders, we believe you can purchase an attractive long-term compounder at a discounted valuation.
We entered a position in Meta Platforms Inc. (META) options during the quarter, first purchasing the September 2027 $600 calls and later rolling the position into the January 2028 $540 calls. We entered the position after the stock sold off early in the quarter as investors grew increasingly concerned about the company’s elevated AI spending and lack of a clear path to monetization. We disagreed with that view. Meta has one of the largest user bases in the world, generates significant operating cash flow, has the distribution and compute resources needed to compete as AI evolves and a proven management team. We were willing to be patient. Later in the quarter, the narrative began to shift as Mark Zuckerberg discussed several potential paths to monetization beyond the core advertising business and the company launched Muse, its personal AI agent. Muse quickly reached the top of the U.S. app store charts and, according to Sensor Tower, was downloaded roughly 5 million times in its first 22 days. While we are still very early in AI’s evolution, we continue to believe the incumbents with scale, distribution, and significant cash generation are best positioned to compete.
We exited Illumina Inc. (ILMN) during the quarter as the stocks approached our estimate of intrinsic value and we looked to reinvest the proceeds into new ideas. We exited JD.com Inc. (JD) to redeploy capital into opportunities we believe offer more attractive risk/reward. Finally, we exited Genius Sports Ltd. (GENI), which was a small position, as we continue to concentrate the portfolio in fewer, larger positions.
Top Contributors and Top Detractors
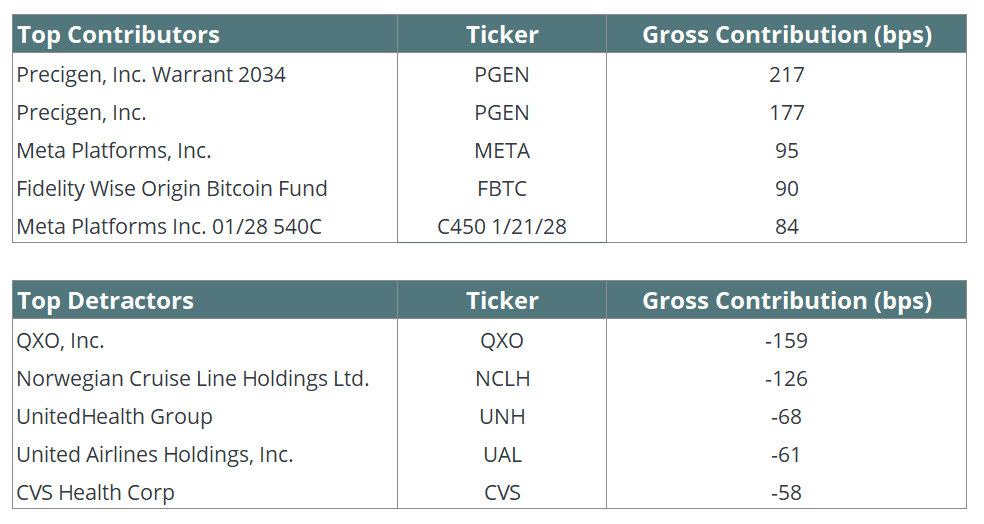 *Contribution and returns provided above are presented gross of fees and includes cash. For full performance of the strategy, please refer to the full performance information that follows the commentary below.
Top Contributors
Precigen Inc. (PGEN) common stock and Precigen Inc. (PGEN) warrants were our top contributors in the third quarter. As long-time followers of the company know, we led a PIPE transaction in December 2024 that gave us exposure through convertible preferreds, which have since converted into common stock, as well as warrants ahead of the company’s pivotal FDA approval. In August 2025, Papzimeos became the first off-the-shelf immunotherapy approved for recurrent respiratory papillomatosis, a patient population that previously had no approved treatment options. Since approval, Precigen has continued to execute, receiving a J-code to support reimbursement, Orphan Drug Designation providing seven years of exclusivity, and, most importantly, FDA platform designation for its AdenoVerse platform. Platform designation is difficult to obtain and important because it allows Precigen to leverage the data, manufacturing work, and regulatory history from Papzimeos to advance additional AdenoVerse products more efficiently. The company already has another AdenoVerse product in development for head and neck and cervical cancer, along with multiple earlier-stage programs, creating the potential for a much broader pipeline than the market is currently valuing. In addition, Precigen’s CAR-T platform could eventually represent a second platform designation opportunity. With a strong launch underway and management expecting to reach a self-funding inflection point by year-end, we believe the market continues to underappreciate Precigen’s potential to evolve from a single-product company into a true biotech platform company.
Despite the sell-off early in the quarter, Meta Platforms Inc. (META) was a top contributor. Like many of the large technology companies, Meta continues to trade on both AI excitement and fear. As the company continued to increase its investment in AI, investors became increasingly focused on whether there would be a real return on that spending. Sentiment shifted with the release of Meta’s Muse agent, which reached 5 million downloads in its first 22 days. While that is an impressive start, we believe we are still very early. Meta has 3.6 billion daily active people across its family of apps, meaning Muse has reached only ~0.1% of the company’s global daily user base. For a company built around capturing consumer attention and distributing products at scale, we believe Meta is well positioned to be one of the long-term winners as AI adoption evolves.
Top Detractors
QXO Inc. (QXO) was a top detractor in the third quarter. We first initiated a position through a PIPE transaction in mid-2024 and have continued to participate in subsequent capital raises, as we believe the market continues to underappreciate the company’s long-term return potential. Led by Brad Jacobs, QXO is pursuing a proven roll-up strategy in the highly fragmented building-products distribution industry. Jacobs’ track record of creating value through consolidation across waste management, equipment rental, and logistics speaks for itself. Since launching the strategy, QXO has completed three acquisitions: Beacon Roofing Supply, Kodiak Building Partners, and TopBuild. While near-term construction activity remains under pressure, our conviction in the long-term value-creation opportunity remains intact. Over the next decade, QXO is targeting more than $50 billion in annual revenue, compared with an expected $13.5 billion this year. We continue to view pullbacks as attractive opportunities to add to our position.
Norwegian Cruise Line Holdings Ltd. (NCLH) fell during the quarter, pressured by weaker than expected 2026 guidance, geopolitical instability in the Middle East, rising fuel costs, and balance sheet concerns. While the quarter reflected continued internal missteps, we believe the issues are fixable. The company appointed John Chidsey as CEO in February, who previously led successful turnarounds at Subway and Burger King, and Elliott Investment Management continues to maintain a 10% economic position while pushing for change. We recognize that Norwegian carries more leverage than its peers, but believe the concern is manageable given the company’s ability to generate meaningful free cash flow in a normalized environment. With the stock trading at a significant discount to peers, a new management team in place, and an experienced activist involved, we continue to believe Norwegian is undervalued relative to its long-term earnings potential.
UnitedHealth Group (UNH) gave back some ground in the third quarter despite raising full-year earnings guidance. The company came under pressure as management commentary pointed to continued elevated medical cost trends. While the cost pressure is something to watch, we believe UnitedHealth’s diversified revenue profile provides cushion to the overall model. The company remains a category leader with a uniquely integrated platform spanning health benefits, pharmacy benefit management, and health services through Optum Health, Optum Rx, and Optum Insight. In our view, its long-term earnings power and competitive position remain intact. We expect earnings to grow in the teens over time, while the stock offers a 2.2% dividend yield and a consistent buyback program. Despite the near-term pressure, we remain confident UnitedHealth can continue to compound earnings and return capital to shareholders over time.
During the third quarter of 2026, the Opportunity Equity Strategy generated a total return of 4.32% net of fees. In comparison, the Strategy's unmanaged benchmark, the S&P 500 Index, returned 2.30%.
Using a three-factor performance attribution model, allocation, selection, and interaction effects contributed to the portfolio’s outperformance. Precigen Inc. Warrants, Precigen Inc. (PGEN), Meta Platforms Inc. (META), Fidelity Wise Origin Bitcoin Fund (FBTC), and Meta Platforms Call Options (C540 1/21/28) were the largest contributors to performance, while QXO Inc. (QXO), Norwegian Cruise Line Holdings Ltd. (NCLH), UnitedHealth Group (UNH), United Airlines Holdings Inc. (UAL), and CVS Health Corp (CVS) were the largest detractors.
Relative to the index, the Strategy was overweight the Health Care, Financials, Consumer Discretionary, Communication Services, and Energy sectors on average during the quarter and in line with the index in Industrials. With zero allocation to Consumer Staples, Materials, Utilities, and Real Estate, the portfolio was underweight these sectors along with Information Technology.
The portfolio entered three new positions, Broadcom Inc. (AVGO), Meta Platforms Call Options (C600 9/17/27), and Meta Platforms Call Options (C540 1/21/28), and exited four positions, Genius Sports Ltd. (GENI), Illumina Inc. (ILMN), JD.com Inc. (JD), and Meta Platforms Call Options (C600 9/17/27) during the quarter.
The portfolio ended the quarter with 37 holdings where the top 10 stocks represented 55.3% of total assets compared to 39.1% for the index, highlighting the Strategy's meaningful active share of around 91.6%.
Portfolio Review
The Strategy continued to perform well in the third quarter, generating a total return of 4.32% net of fees. The broader market also advanced, with the S&P 500 gaining 2.30% and reaching new all-time highs during the period. Despite the headline gains, market breadth narrowed, with the S&P 500 Equal Weight Index declining 1.90% as large-caps regained leadership. Within technology, software rebounded from losses earlier in the year and outperformed semiconductors. Single stock volatility has remained high, which suits our investment style as we focus on buying businesses that are out of favor when we believe the market has become overly negative. We invest for the long term and do not expect positions to work immediately, but several stocks we purchased following sharp declines earlier in the year have begun to show traction.
Adobe Inc. (ADBE), a name we entered during the “SaaS apocalypse,” started to recover from its lows. While AI concerns continue to weigh on the narrative, the company has now delivered two consecutive quarters of revenue and EPS beats while raising full-year guidance. The market will likely continue to question the durability of the business, but we believe Adobe is taking the right steps to integrate and monetize AI through its Firefly platform, and elsewhere. Despite the headlines, the company continues to generate significant free cash flow, trades at a 12% free cash flow yield, and has repurchased a net 18% of shares outstanding over the past five years.
Payments names, which we called out last quarter as attractive new opportunities, also performed well. Chime Financial Inc. (CHYM) gained 30%, Global Payments Inc. (GPN) gained 13%, and Adyen NV (ADYEN) gained 6%. We continue to see material upside in all three as the companies execute.
We view Chime as being in the early stages of what Nick Sleep referred to as “scaled economies shared.” As the low-cost provider serving a customer base that is often uneconomic for traditional competitors, Chime has carved out a niche position in an attractive market. Over time, we believe the company can continue to reinvest its scale advantages into new products, better pricing, and a broader customer relationship.
Global Payments is a classic example of the market becoming overly pessimistic on a legacy provider without fully appreciating how sticky the business remains. The company trades at just 5x 2027 EPS with a 17% free cash flow yield, while continuing to return capital to shareholders through buybacks and dividends.
Adyen was once a market darling and is slowly working to regain that reputation. It remains one of the leading next-generation global payments companies, yet trades at just 16.6x 2027 earnings after adjusting for excess cash despite having sustained growth in the 20% range.
More broadly, the quarter was a reminder that when expectations are low, companies do not need everything to go right for the stocks to work. They simply need results to hold up and the narrative to stop getting worse. We continue to see a number of these opportunities across the portfolio.
New and Eliminated
This quarter we entered three new positions and exited four.
We entered a position in Broadcom Inc. (AVGO) during the quarter, a leading semiconductor and infrastructure software company. Despite being one of the clearest beneficiaries of AI infrastructure spending, the stock has lagged the broader AI trade as investors focused on customer concentration, competition, and the durability of custom silicon demand. We believe those concerns are creating an attractive entry point. Broadcom is uniquely positioned across two important AI infrastructure bottlenecks: custom accelerators and high-performance networking. Hyperscalers are increasingly using purpose-built chips to lower the cost and power consumption of large-scale AI workloads, and Broadcom is one of the few companies capable of supporting that transition at scale. Under CEO Hock Tan, Broadcom has built an exceptional track record of disciplined capital allocation, operational execution, and shareholder returns. Management now expects AI semiconductor revenue to reach roughly $58 billion in fiscal 2026 and has guided for that revenue to roughly double in both fiscal 2027 and fiscal 2028, reaching approximately $230 billion and representing nearly 100% year-over-year growth in each year. At the same time, Broadcom’s high-margin software business provides stability and significant free cash flow. Today, the company trades roughly in line with the market at ~20x forward earnings while growing earnings at more than 4.5x the market rate. With strong free cash flow generation, high incremental returns, and a consistent history of returning cash to shareholders, we believe you can purchase an attractive long-term compounder at a discounted valuation.
We entered a position in Meta Platforms Inc. (META) options during the quarter, first purchasing the September 2027 $600 calls and later rolling the position into the January 2028 $540 calls. We entered the position after the stock sold off early in the quarter as investors grew increasingly concerned about the company’s elevated AI spending and lack of a clear path to monetization. We disagreed with that view. Meta has one of the largest user bases in the world, generates significant operating cash flow, has the distribution and compute resources needed to compete as AI evolves and a proven management team. We were willing to be patient. Later in the quarter, the narrative began to shift as Mark Zuckerberg discussed several potential paths to monetization beyond the core advertising business and the company launched Muse, its personal AI agent. Muse quickly reached the top of the U.S. app store charts and, according to Sensor Tower, was downloaded roughly 5 million times in its first 22 days. While we are still very early in AI’s evolution, we continue to believe the incumbents with scale, distribution, and significant cash generation are best positioned to compete.
We exited Illumina Inc. (ILMN) during the quarter as the stocks approached our estimate of intrinsic value and we looked to reinvest the proceeds into new ideas. We exited JD.com Inc. (JD) to redeploy capital into opportunities we believe offer more attractive risk/reward. Finally, we exited Genius Sports Ltd. (GENI), which was a small position, as we continue to concentrate the portfolio in fewer, larger positions.
Top Contributors and Top Detractors
*Contribution and returns provided above are presented gross of fees and includes cash. For full performance of the strategy, please refer to the full performance information that follows the commentary below.Top Contributors
Precigen Inc. (PGEN) common stock and Precigen Inc. (PGEN) warrants were our top contributors in the third quarter. As long-time followers of the company know, we led a PIPE transaction in December 2024 that gave us exposure through convertible preferreds, which have since converted into common stock, as well as warrants ahead of the company’s pivotal FDA approval. In August 2025, Papzimeos became the first off-the-shelf immunotherapy approved for recurrent respiratory papillomatosis, a patient population that previously had no approved treatment options. Since approval, Precigen has continued to execute, receiving a J-code to support reimbursement, Orphan Drug Designation providing seven years of exclusivity, and, most importantly, FDA platform designation for its AdenoVerse platform. Platform designation is difficult to obtain and important because it allows Precigen to leverage the data, manufacturing work, and regulatory history from Papzimeos to advance additional AdenoVerse products more efficiently. The company already has another AdenoVerse product in development for head and neck and cervical cancer, along with multiple earlier-stage programs, creating the potential for a much broader pipeline than the market is currently valuing. In addition, Precigen’s CAR-T platform could eventually represent a second platform designation opportunity. With a strong launch underway and management expecting to reach a self-funding inflection point by year-end, we believe the market continues to underappreciate Precigen’s potential to evolve from a single-product company into a true biotech platform company.
Despite the sell-off early in the quarter, Meta Platforms Inc. (META) was a top contributor. Like many of the large technology companies, Meta continues to trade on both AI excitement and fear. As the company continued to increase its investment in AI, investors became increasingly focused on whether there would be a real return on that spending. Sentiment shifted with the release of Meta’s Muse agent, which reached 5 million downloads in its first 22 days. While that is an impressive start, we believe we are still very early. Meta has 3.6 billion daily active people across its family of apps, meaning Muse has reached only ~0.1% of the company’s global daily user base. For a company built around capturing consumer attention and distributing products at scale, we believe Meta is well positioned to be one of the long-term winners as AI adoption evolves.
Top Detractors
QXO Inc. (QXO) was a top detractor in the third quarter. We first initiated a position through a PIPE transaction in mid-2024 and have continued to participate in subsequent capital raises, as we believe the market continues to underappreciate the company’s long-term return potential. Led by Brad Jacobs, QXO is pursuing a proven roll-up strategy in the highly fragmented building-products distribution industry. Jacobs’ track record of creating value through consolidation across waste management, equipment rental, and logistics speaks for itself. Since launching the strategy, QXO has completed three acquisitions: Beacon Roofing Supply, Kodiak Building Partners, and TopBuild. While near-term construction activity remains under pressure, our conviction in the long-term value-creation opportunity remains intact. Over the next decade, QXO is targeting more than $50 billion in annual revenue, compared with an expected $13.5 billion this year. We continue to view pullbacks as attractive opportunities to add to our position.
Norwegian Cruise Line Holdings Ltd. (NCLH) fell during the quarter, pressured by weaker than expected 2026 guidance, geopolitical instability in the Middle East, rising fuel costs, and balance sheet concerns. While the quarter reflected continued internal missteps, we believe the issues are fixable. The company appointed John Chidsey as CEO in February, who previously led successful turnarounds at Subway and Burger King, and Elliott Investment Management continues to maintain a 10% economic position while pushing for change. We recognize that Norwegian carries more leverage than its peers, but believe the concern is manageable given the company’s ability to generate meaningful free cash flow in a normalized environment. With the stock trading at a significant discount to peers, a new management team in place, and an experienced activist involved, we continue to believe Norwegian is undervalued relative to its long-term earnings potential.
UnitedHealth Group (UNH) gave back some ground in the third quarter despite raising full-year earnings guidance. The company came under pressure as management commentary pointed to continued elevated medical cost trends. While the cost pressure is something to watch, we believe UnitedHealth’s diversified revenue profile provides cushion to the overall model. The company remains a category leader with a uniquely integrated platform spanning health benefits, pharmacy benefit management, and health services through Optum Health, Optum Rx, and Optum Insight. In our view, its long-term earnings power and competitive position remain intact. We expect earnings to grow in the teens over time, while the stock offers a 2.2% dividend yield and a consistent buyback program. Despite the near-term pressure, we remain confident UnitedHealth can continue to compound earnings and return capital to shareholders over time.
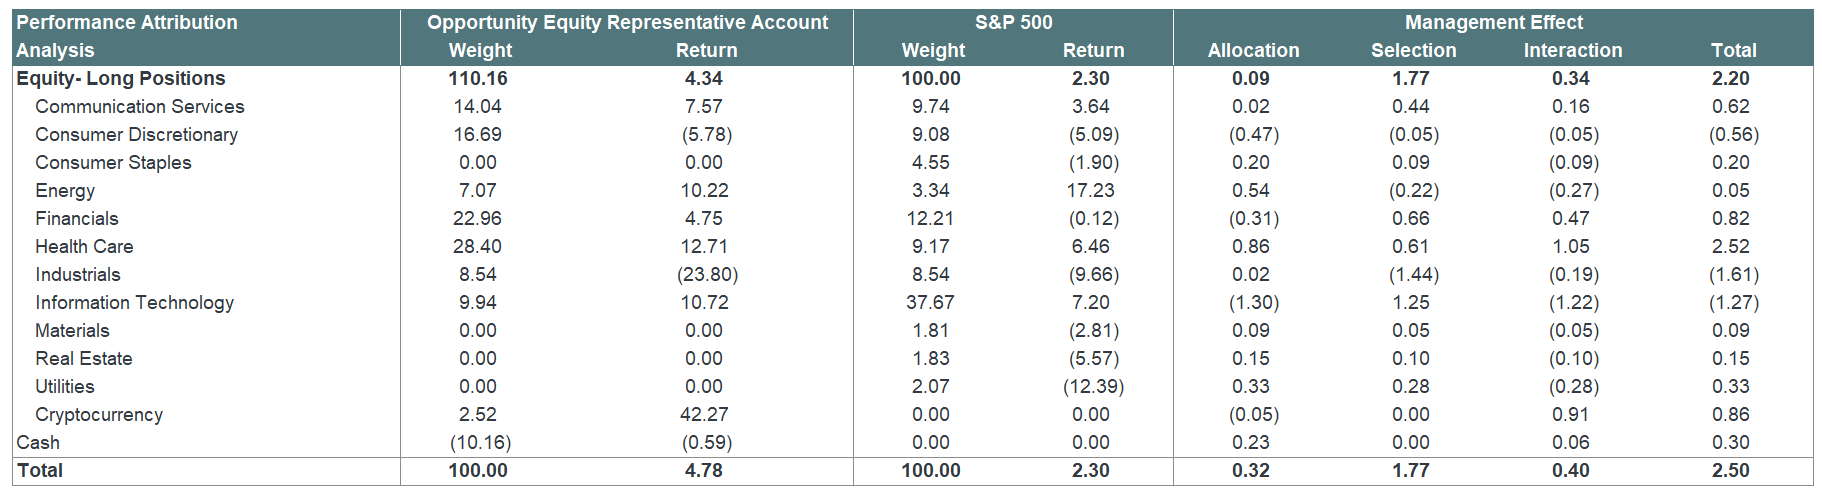
Performance Attribution is provided as a Portfolio Characteristic and is calculated on a gross basis. For the full strategy returns calculated on a gross and net basis, please refer to the full strategy performance presentation that follows the commentary. Total portfolio return figures provided above reflect the sum of the returns of the holdings in the representative account portfolio due to price movements and dividend payments or other sources of income Market Proxy is S&P 500. Returns greater than 1 year are annualized. Source: Bloomberg and Patient Capital Management.
The data provided is from APX and Patient Capital Management, LLC and is believed to be reliable, but is not guaranteed as to its timeliness or accuracy.
Percentages and returns may not sum to 100% due to rounding effects. A three-factor attribution consists of the allocation effect, selection effect, and the
interaction effect, which sum to the portfolio’s performance relative to the benchmark.
• Allocation. The allocation effect represents the portion of the portfolio’s excess return attributable to differences in sector weights between the portfolio and the benchmark index.
• Selection. The selection effect represents the portion of the portfolio’s excess return attributable to differences in the weights of individual securities within each sector between the portfolio and the benchmark index.
• Interaction. Most complex and sometimes counterintuitive, the interaction effect represents the portion of the portfolio’s excess return attributable to combining sector allocation decisions with security selection decisions, and is often thought of as measuring the accuracy of manager’s convictions. Please note that the methodology used by our independent third-party attribution software vendor will at times present sector allocation effects that are counterintuitive. For example, the software may calculate a negative sector effect even when the portfolio, on a weighted average basis for the period, overweight an outperforming sector. Under the vendor’s methodology, allocation effects in recent months may overwhelm the allocation effects from earlier in the period, particularly over longer time frames.
The S&P 500 Index (SPX) is a market capitalization-weighted index of 500 widely held common stocks. Investors cannot invest directly in an index and unmanaged index returns do not reflect any fees, expenses or sales charges. Earnings per share (EPS) is the portion of a company’s profit allocated to each outstanding share of common stock and serves as an indicator of a company’s profitability. Price to earnings is the market price per share divided by earnings per share. Active share is a measure of the percentage of stock holdings in a manager’s portfolio that differs from the benchmark index.
All historical financial information is unaudited and shall not be construed as a representation or warranty by us. References to indices and their respective performance data are not intended to imply that the Strategy’s objectives, strategies or investments were comparable to those of the indices in technique, composition or element of risk nor are they intended to imply that the fees or expense structures relating to the Strategy or its affiliates, were comparable to those of the indices; since the indices are unmanaged and cannot be invested in directly. The Strategy does not directly invest in or seek access to the spot price of Bitcoin. Bitcoin and other cryptocurrencies are a relatively new asset class and are subject to unique and substantial risks.
Earnings growth is not representative of the Strategy’s future performance. FCF refers to Free Cash Flow and is earnings before depreciation, amortization, and non-cash charges minus maintenance capital expenditures. Free cash flow yield is a financial valuation metric that measures a company's annual free cash flow relative to its share price or total company value. Earnings per share (EPS) is the portion of a company’s profit allocated to each outstanding share of common stock and serves as an indicator of a company’s profitability. A dividend yield is a financial ratio that measures how much cash a company pays out in dividends each year relative to its current share price, expressed as a percentage.
The Opportunity Equity composite performance figures reflected above include the deduction of a model investment management fee of 1% (the highest fee for separate accounts under our fee schedule), paid quarterly and certain other expenses. For important information about Opportunity Equity Strategy performance, please click on the Opportunity Equity Strategy Composite Performance Disclosure. Past performance is no guarantee of future results.
All holdings and portfolio data are reflective of a representative Opportunity Equity account.
This information does not constitute, and should not be construed as, investment advice or recommendations with respect to the securities and sectors listed. All investments are subject to risk, including the possible loss of principal. There is no guarantee investment objectives will be met. Neither Patient Capital Management, LLC, nor its information providers are responsible for any damages or losses arising from any use of this information.
Earnings growth is not a measure of future performance.
The views expressed in this commentary reflect those of Patient Capital Management portfolio managers and analysts as of the date of the commentary. Any views are subject to change at any time based on market or other conditions, and Patient Capital Management disclaims any responsibility to update such views. These views are not intended to be a forecast of future events, a guarantee of future results or investment advice. Because investment decisions are based on numerous factors, these views may not be relied upon as an indication of trading intent on behalf of any portfolio. Any data cited herein is from sources believed to be reliable but is not guaranteed as to accuracy or completeness. The information presented should not be considered a recommendation to purchase or sell any security and should not be relied upon as investment advice. It should not be assumed that any purchase or sale decisions will be profitable or will equal the performance of any security mentioned.
References to specific securities are for illustrative purposes only. Portfolio composition is shown as of a point in time and is subject to change without notice. All historical financial Information is unaudited and shall not be construed as a representation or warranty by us. References to indices and their respective performance data are not intended to imply that the Strategy’s objectives, strategies or investments were comparable to those of the indices in technique, composition or element of risk nor are they intended to imply that the fees or expense structures relating to the Strategy or its affiliates, were comparable to those of the indices; since the indices are unmanaged and cannot be invested in directly. Returns for periods greater than one year are annualized.
The performance information depicted herein is not indicative of future results. There can be no assurance that the Strategy’s investment objectives will be achieved and a return realized. Past performance is no guarantee of future results.
Contributors detailed above represent the top five securities that contributed positively to performance during the quarter. Detractors detailed above represent the top five securities that detracted from performance during the quarter. Information detailed above is provided gross of fees and includes cash. Contribution listed above represents the period when the security was held during the quarter. For additional information on how Top Contributors and Top Detractors were determined and/or to obtain a list showing every holding’s contribution to the Strategy’s performance contact us.
The information presented should not be considered a recommendation to purchase or sell any security and should not be relied upon as investment advice. It should not be assumed that any purchase or sale decisions will be profitable or will equal the performance of any security mentioned. Any third party links, trademarks, service markets, logos and trade names included in the report are property of their respective owners.
©2026 Patient Capital Management, LLC
| QTD | YTD | 1-Year | 3-Year | 5-Year | 10-Year | Since Inception (12/30/1999) | |
| Opportunity Equity Strategy (gross of fees) | 4.57% | 15.78% | 23.44% | 31.22% | 10.12% | 14.42% | 9.87% |
| Opportunity Equity Strategy (net of fees) | 4.32% | 14.93% | 22.24% | 29.94% | 9.03% | 13.29% | 8.79% |
| S&P 500 Index | 2.30% | 12.75% | 15.74% | 22.89% | 13.79% | 15.33% | 8.34% |
Share