The macro backdrop remains complicated. Inflation continued to come in better than expected, with headline CPI reaching 3.4% in August, while core PCE, the Fed’s preferred underlying inflation gauge, remained at 3.0%. At the same time, the labor market remained resilient, with unemployment holding at 4.1% in August and initial jobless claims continuing to trend lower. Nominal GDP remained robust, coming in at 6.3% in June.
Despite resilient economic data, consumer sentiment weakened further, with the University of Michigan sentiment index falling to 48.1 in September, though the weakness has not yet translated into consumer spending, as retail sales rose 1.2% month over month in August. Meanwhile, the 10-year Treasury yield moved above 5%, its highest level in roughly two decades. Higher borrowing costs flowed through to mortgage rates, which moved back above 7%, adding further pressure to housing affordability as starts and permits declined in August.
Against this mixed backdrop, the Fed unanimously raised the fed funds rate by 25 basis points to 3.75% to 4.00%, its first hike since 2023. Markets continued to price in another increase by year-end, though softer-than-expected PCE data reduced expectations for an October move.
--------------------------------------------------------------------------------------------------------------------------------------------------------------------------
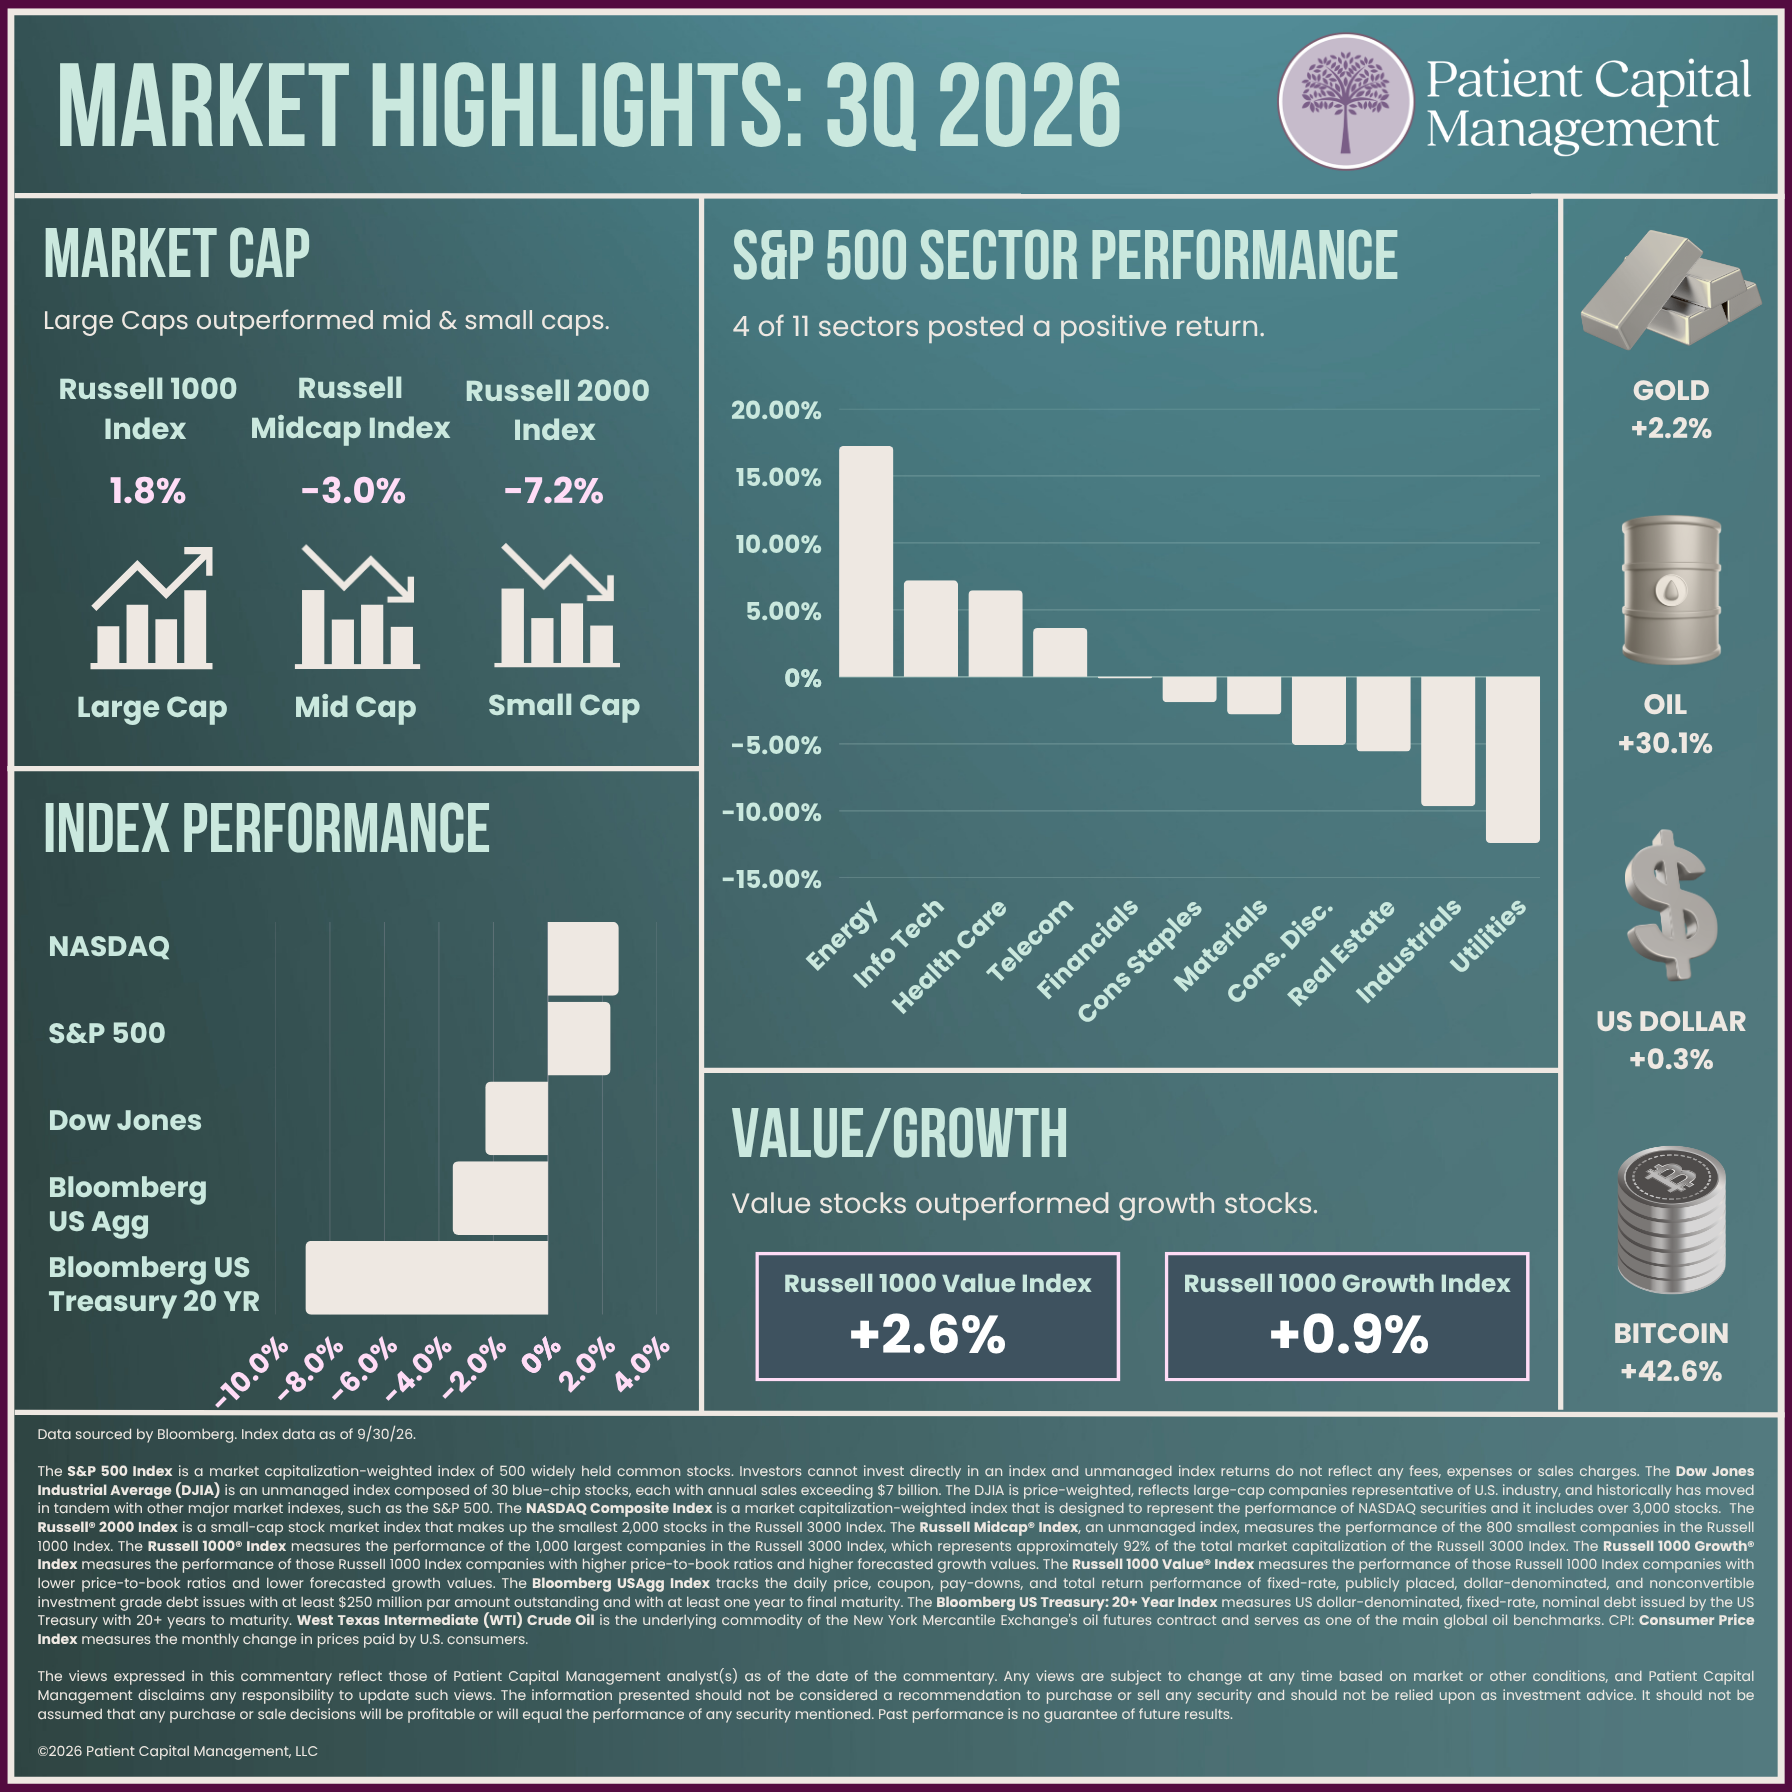
The Nasdaq Composite led the major benchmarks, advancing 2.6%, followed by the S&P 500, which gained 2.3%, while the Dow Jones Industrial Average declined 2.3%. Four of the eleven sectors within the S&P 500 posted positive returns. Energy led, rising 17.2%, followed by Information Technology and Health Care, which returned 7.2% and 6.5%, respectively. Utilities declined 12.4%, its worst quarter since the first quarter of 2020.
Large-caps led this quarter, with the Russell 1000 gaining 1.8%, outperforming both mid-caps and small caps. The Russell Midcap Index fell 3.0%, while the Russell 2000 declined 7.2%. Value regained the lead, outperforming growth, with the Russell 1000 Value Index rising 2.6% compared with a 0.9% return for the Russell 1000 Growth Index.
Bonds were negative and underperformed all major equity indexes in the quarter. US Corporates declined as the Bloomberg Aggregate returned -3.5%, while long-dated US Treasuries fell 8.9%.
The U.S. dollar gained 0.3% during the quarter, while gold rose 2.2%. West Texas Intermediate (WTI) surged 30.1% as tensions in the Middle East reignited, bringing its year-to-date gain to 57.5%. Bitcoin snapped its three-quarter losing streak, rallying 42.6% to end the quarter at $83.6K.
Data sourced by Bloomberg. Index data as of 09/30/26.
The S&P 500 Index is a market capitalization-weighted index of 500 widely held common stocks. Investors cannot invest directly in an index and unmanaged index returns do not reflect any fees, expenses or sales charges. The Dow Jones Industrial Average (DJIA) is an unmanaged index composed of 30 blue-chip stocks, each with annual sales exceeding $7 billion. The DJIA is price-weighted, reflects large-cap companies representative of U.S. industry, and historically has moved in tandem with other major market indexes, such as the S&P 500. The NASDAQ Composite Index is a market capitalization-weighted index that is designed to represent the performance of NASDAQ securities and it includes over 3,000 stocks. The Russell® 2000 Index is a small-cap stock market index that makes up the smallest 2,000 stocks in the Russell 3000 Index. The Russell Midcap® Index, an unmanaged index, measures the performance of the 800 smallest companies in the Russell 1000 Index. The Russell 1000® Index measures the performance of the 1,000 largest companies in the Russell 3000 Index, which represents approximately 92% of the total market capitalization of the Russell 3000 Index. The Russell 1000 Growth® Index measures the performance of those Russell 1000 Index companies with higher price-to-book ratios and higher forecasted growth values. The Russell 1000 Value® Index measures the performance of those Russell 1000 Index companies with lower price-to-book ratios and lower forecasted growth values. The Bloomberg US Treasury: 20+ Year Index measures US dollar-denominated, fixed-rate, nominal debt issued by the US Treasury with 20+ years to maturity. The Bloomberg USAgg Index is a broad-based flagship benchmark that measures the investment grade, US dollar- denominated, fixed-rate taxable bond market. The index includes Treasuries, government-related and corporate securities, MBS (agency fixed-rate pass-throughs), ABS and CMBS (agency and non-agency). West Texas Intermediate (WTI) Crude Oil is the underlying commodity of the New York Mercantile Exchange's oil futures contract and serves as one of the main global oil benchmarks. CPI: Consumer Price Index measures the monthly change in prices paid by U.S. consumers. PCE: Personal consumption expenditures includes a measure of consumer spending on goods and services among households in the US. GDP: Nominal gross domestic product (GDP) measures a country's total economic production using current market prices without adjusting for inflation or deflation. PCE, CPI, GDP, and inflation rates based on available data at the time the piece was written and are not guaranteed to stay the same in the future.
The views expressed in this commentary reflect those of Patient Capital Management analyst(s) as of the date of the commentary. Any views are subject to change at any time based on market or other conditions, and Patient Capital Management disclaims any responsibility to update such views. The information presented should not be considered a recommendation to purchase or sell any security and should not be relied upon as investment advice. It should not be assumed that any purchase or sale decisions will be profitable or will equal the performance of any security mentioned. Past performance is no guarantee of future results.
©2026 Patient Capital Management, LLC
Share