Despite a 43-day federal government shutdown that delayed and disrupted the release of key economic data, the Federal Reserve continued to ease monetary policy, cutting rates by 25 basis points in both October and December. The year ended with the federal funds target range at 3.50%–3.75%, a level not seen since 2022. Throughout the quarter, the Fed remained focused on signs of labor market weakness, even as inflation data became more uneven The U.S. unemployment rate rose to 4.6% in November, its highest level outside of COVID since 2017. Meanwhile, headline CPI edged lower to 2.7% in November from 3.0% in September; however, data disruptions caused by the shutdown have raised concerns that this improvement may prove temporary. Markets are now fully pricing in two additional rate cuts in 2026.
Consumer spending remained resilient through the holiday season, with sales up 3.9% year-over-year according to Mastercard SpendingPulse. Despite this strength, consumer sentiment continued to deteriorate, falling to 52.9 in December, a level below 99% of historical readings.
As we enter 2026, solid economic growth and resilient consumer spending continue to underpin the outlook. While concerns around an AI-driven bubble and elevated equity valuations have increased, high levels of skepticism have historically been a constructive force for markets, often supporting continued upside. With equities rising in roughly 70% of years, the backdrop remains favorable for further gains.
-----------------------------------------------------------------------------------------------------------------------------------------------------
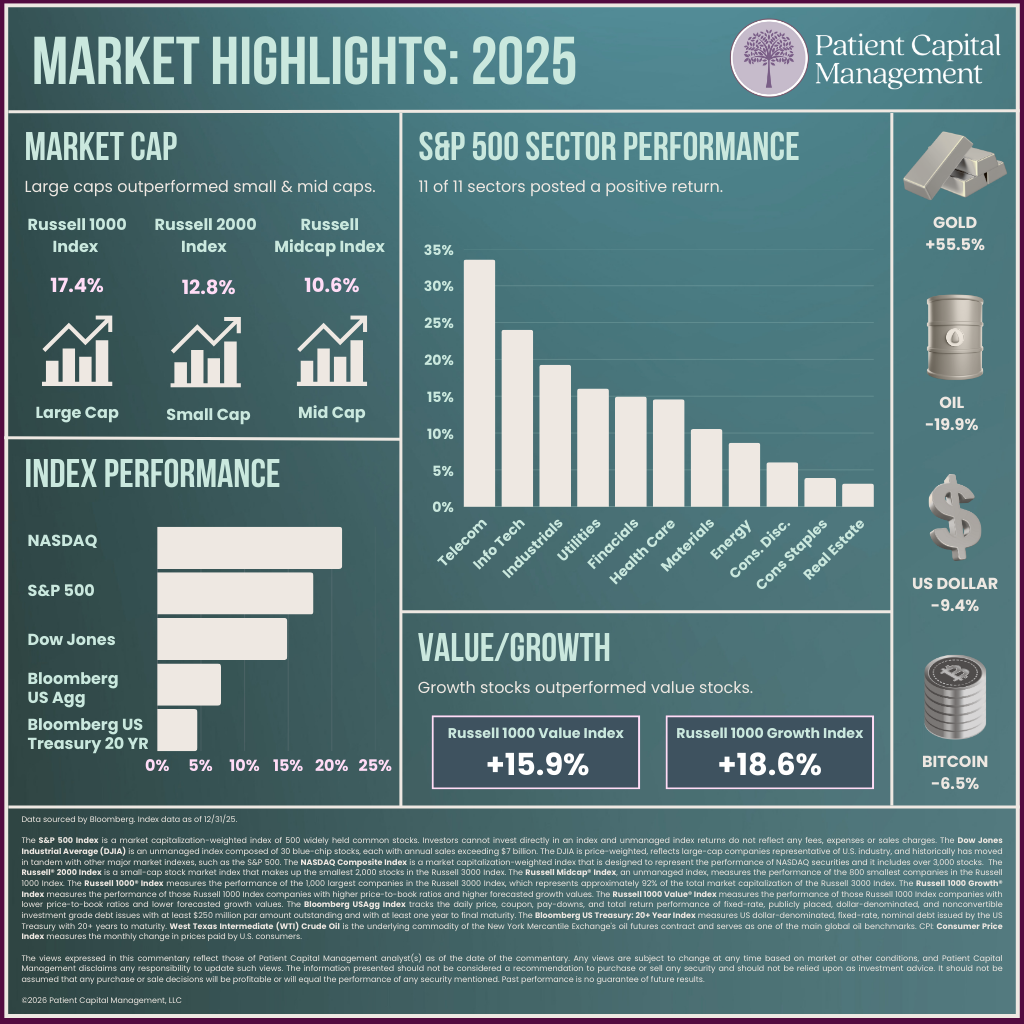
The Nasdaq Composite continued its lead gaining 21.2% in 2025, followed by the S&P500’s 17.9% gain and the Dow Jones Industrial Average’s rise of 14.9%. All eleven sectors in the S&P500 posted positive returns for the year. Telecommunications and Information Technology continued to lead posting returns of 33.6% and 24.0%, respectively.
Large-caps maintained their leadership outperforming both small-caps and mid-caps. The Russell 1000 gained 17.4% compared to the Russell 2000 Index’s return of 12.8% and the Russell Mid-Cap Index’s rise of 10.6%. Growth maintained its lead over value, with the Russell 1000 Growth Index climbing 18.6% compared to the Russell 1000 Value Index’s gain of 15.9%.
Bonds returns were positive but underperformed all major equity indexes. US Corporates outperformed long-dated US Treasuries with the Bloomberg Aggregate gaining 7.3% while 20+YR Treasuries gained 4.6%.
The US Dollar lost 9.4% over the year while Gold continued its impressive climb gaining 55.5%. Commodities were up 11.1% YoY despite West Texas Intermediate (WTI) crude declining 19.9%. Bitcoin reached an all-time high in October but ended up the year down 6.5% at $87,648.
Data sourced by Bloomberg. Index data as of 12/31/25.
The S&P 500 Index is a market capitalization-weighted index of 500 widely held common stocks. Investors cannot invest directly in an index and unmanaged index returns do not reflect any fees, expenses or sales charges. The Dow Jones Industrial Average (DJIA) is an unmanaged index composed of 30 blue-chip stocks, each with annual sales exceeding $7 billion. The DJIA is price-weighted, reflects large-cap companies representative of U.S. industry, and historically has moved in tandem with other major market indexes, such as the S&P 500. The NASDAQ Composite Index is a market capitalization-weighted index that is designed to represent the performance of NASDAQ securities and it includes over 3,000 stocks. The Russell® 2000 Index is a small-cap stock market index that makes up the smallest 2,000 stocks in the Russell 3000 Index. The Russell Midcap® Index, an unmanaged index, measures the performance of the 800 smallest companies in the Russell 1000 Index. The Russell 1000® Index measures the performance of the 1,000 largest companies in the Russell 3000 Index, which represents approximately 92% of the total market capitalization of the Russell 3000 Index. The Russell 1000 Growth® Index measures the performance of those Russell 1000 Index companies with higher price-to-book ratios and higher forecasted growth values. The Russell 1000 Value® Index measures the performance of those Russell 1000 Index companies with lower price-to-book ratios and lower forecasted growth values. The Bloomberg US Treasury: 20+ Year Index measures US dollar-denominated, fixed-rate, nominal debt issued by the US Treasury with 20+ years to maturity. The Bloomberg USAgg Index is a broad-based flagship benchmark that measures the investment grade, US dollar- denominated, fixed-rate taxable bond market. The index includes Treasuries, government-related and corporate securities, MBS (agency fixed-rate pass-throughs), ABS and CMBS (agency and non-agency). West Texas Intermediate (WTI) Crude Oil is the underlying commodity of the New York Mercantile Exchange's oil futures contract and serves as one of the main global oil benchmarks. CPI: Consumer Price Index measures the monthly change in prices paid by U.S. consumers. PCE: Personal consumption expenditures includes a measure of consumer spending on goods and services among households in the US. PCE, CPI, and inflation rates based on available data at the time the piece was written and are not guaranteed to stay the same in the future.
The views expressed in this commentary reflect those of Patient Capital Management analyst(s) as of the date of the commentary. Any views are subject to change at any time based on market or other conditions, and Patient Capital Management disclaims any responsibility to update such views. The information presented should not be considered a recommendation to purchase or sell any security and should not be relied upon as investment advice. It should not be assumed that any purchase or sale decisions will be profitable or will equal the performance of any security mentioned. Past performance is no guarantee of future results.
©2026 Patient Capital Management, LLC
Share