| QTD | YTD | 1-Year | 3-Year | 5-Year | 10-Year | Since Inception (12/30/99) | |
| Opportunity Equity (gross of fees) | 10.11 | 10.11 | -23.74 | 15.92 | 3.88 | 9.28 | 7.12 |
| Opportunity Equity (net of fees) | 9.84 | 9.84 | -24.52 | 14.78 | 2.84 | 8.20 | 6.06 |
| S&P 500 Index | 7.50 | 7.50 | -7.73 | 18.60 | 11.19 | 12.24 | 6.54 |
We ended another surprise-filled quarter, which really should be no surprise at all. The future is unpredictable. The markets rose in the quarter, led by technology. Within technology, smaller unprofitable companies generally did best. We encountered a mostly unforeseen banking crisis. Amidst all this, Patient Partners, LP net of fees rose 12.8% relative to the S&P 500’s 7.5% return and the S&P 1500’s 6.67% rise. Mega-caps posted the strongest returns, leading to a lagging equal-weighted S&P 500’s 2.9% return.
It reminds us of the short story David Swan by Nathaniel Hawthorne. While traveling to Boston, David falls asleep in the woods while awaiting his carriage. An older couple pass by. Having recently lost their son, they discuss making him their heir. A beautiful young lady who finds him attractive, also considers waking him. Finally, two thieves attempt to rob him, deciding to kill him if necessary. All leave without David waking. He then continues his trip, unaware of his close encounters with wealth, love, and death. The story concludes: it’s remarkable there’s “regularity enough in mortal life to render foresight even partially available” given “viewless and unexpected events thrust themselves continually athwart our path.”
Entering the year, Wall Street Strategists projected the market would decline in 2023 – the first such prediction since the turn of the century, according to Birinyi Associates (see chart). The conventional view called for market losses in the first half, followed by a rebound (as if calling the general direction isn’t difficult enough). Strategists mostly expected technology to continue to lag. While many pronounced elevated risks, a potential banking crisis wasn’t articulated.
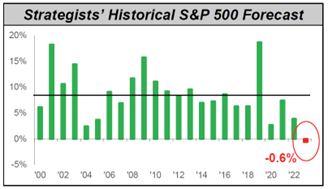
Source: Birinyi Associates
The future is too complicated to predict. Peter Drucker, the great management theorist, and consultant said, “Trying to predict the future is like trying to drive down a country road at night with no lights while looking out the back window.” The biggest surprise: people continue to try. Others continue to listen. Most shocking may have been the market’s resilience in the face of the challenges, especially a banking crisis.
The crisis triggered valid questions about similarities to the Financial Crisis. We see important differences between now and then. Back then, broad, levered exposure to housing created disastrous effects as home prices fell. A credit and confidence crisis ensued. Trust evaporated in even the safest institutions. AAA credit spreads peaked at more than double prior peaks1. Consumer wealth got crushed, and business activity ground to a halt.
The current crisis differs greatly. To combat inflation, the Fed withdrew massive liquidity from the system by increasing interest rates more quickly than any time since the early 80s. Higher interest rates led to lower asset prices. Banks, which had piled into safe and liquid treasuries and agencies after the financial crisis, were left with losses on their bond portfolios. Though these posed no risk of loss if held-to-maturity, concerns grew about banks’ ability to do so as deposits moved to higher-yielding alternatives. At a few institutions, significant bank runs resulted.
As Jamie Dimon recently told CNN, “This is not 2008…This is a much more limited – there are only a handful of banks that had this particular problem. They’ll eventually be resolved…”
We find the speed of the runs most troubling. Depositors withdrew $42B in one day from Silicon Valley Bank. Another $100B was leaving the following day. That’s 82% of the bank’s deposits! No bank can withstand that. Washington Mutual, the largest bank failure, lost 9% of its deposits over 9 days in its fatal run. These days social media, Internet banking and a concentrated depositor base can accelerate the deadly impact of a banking panic beyond hope.
We need to consider ways to improve systemic resiliency. We think unlimited deposit insurance would help most. We’re not optimistic this idea has any chance given its widespread unpopularity. A higher limit on deposit insurance would at least help.
Fortunately, authorities responded quickly and aggressively to avoid depositor losses, much like death averted for David Swan. Depositors at failed banks were protected. The Fed’s Bank Term Funding Facility injected substantial liquidity onto banks’ balance sheets.
That’s important because liquidity injections can solve this problem, in our opinion (at least at this stage). Banks can now post bonds at the Fed for access to liquidity at par. The decline in long term interest rates increased bond prices, also helping.
That doesn’t mean we’ve got the all-clear signal. Those liquidity injections are being offset by continued interest rate increases. One hand giveth, the other taketh away.
The market believes the Fed is intent on pushing us into recession. Unlike earlier in the year, the market now responds to bad news negatively. Banks have tightened a record amount in the past two weeks making the odds of a “soft landing” slimmer. The consumer, which accounts for more than 2/3 of the economy, continues to surprise with its resilience. Consumer balance sheets remain strong. Many estimate robust spending can be maintained for a number of quarters, providing a modicum of hope.
We think interest rate increases are borderline reckless at this stage. Monetary policy works with a lag, and we are just beginning to see the impact. Money supply, as measured by M2, fell over 2% from a year ago. This hasn’t happened since The Great Depression!
Inflation is a lagging indicator. Barry Sternlicht from Starwood Capital told CNBC his data scientists calculate a 2.6% inflation rate using real-time housing prices. Markets forecast nearly the same over the next 2 years. We’re not aware of any research justifying 2% inflation as optimal. Inflation between 2-3% would be entirely manageable. Why would 2% inflation with 5% unemployment be preferable to 2.6% inflation with 3.5% unemployment? We believe the Fed’s main concern is losing its inflation fighting credibility. Since that’s not currently in doubt, the rationale falls short.
We’ve already spent too much time discussing macro. We think Peter Lynch nailed it when he said, “If you spend more than 13 minutes analyzing economic and market forecasts, you've wasted 10 minutes.”
History is littered with bad forecasts. Even the mightiest of investors, Warren Buffett, wrongly projected inflation would result from Financial Crisis stimulus. More discouraging, right calls don’t necessarily make you money. After the Financial Crisis, Mohamed El-Erian and Bill Gross, of PIMCO at the time, coined the term “the new normal” to project a prolonged period of low economic growth and low market returns. While they were right on the economy, the market notched one of its best decades in history. Much like how the current quarter combined market gains with projected macro challenges.
We spend the bulk of our time analyzing and researching companies. We know we will face inevitable challenges. We aim to position the portfolio to weather storms and do well over the long term. We also use market volatility to improve portfolio positioning whenever we can. So where do we see opportunity?
Financials got hit in the quarter. In a matter of weeks, banks underperformed by as much as they did in the entire early 90’s savings and loan crisis (see chart). Valuations, especially for regional banks, suggest an opportunity.

We analyze market expectations relative to fundamentals. The optimal combination is low expectations and strong fundamentals. For many companies, these two sides of the equation are mostly distinct. Some companies, though, have significant feedback loops between market expectations and business fundamentals. For banks, rapidly falling expectations (eg- market panic) can kill business fundamentals, as recent failures demonstrate. This warrants more caution.
We did find one opportunity irresistible. We initiated a new position in UBS Group (UBS $20.79). UBS was well-positioned enough to be the anointed savior of the failed Credit Suisse. We think UBS got a sweetheart deal. We aren’t alone. JP Morgan penned a recent piece titled, “Transformative deal creating a Wealth Management powerhouse.”
The Financial Times reported that Credit Suisse’s Swiss bank alone was worth 3x the price paid. UBS guided for pro forma tangible book value of over $28 per share implying it’s trading at 0.7x tangible book value. This is cheaper than all but the most troubled regional banks.
The integration will be messy and prolonged, which is enough to deter most investors. Longer-term, we think business fundamentals will be greatly improved (unlike regional banks who likely face increased regulatory pressure). Scale will increase and business mix will shift towards asset management. Both should improve returns on equity. We think UBS should be able to earn over $4 per share in a few years, with a mid-to-high teens return on tangible equity. We think the stock should double over that horizon.
Overall, we think the portfolio is very well-positioned. We have abundant patience for the market to warm to our view. Our biggest position, and one of our favorite ideas, is Expedia (EXPE $94). It demonstrates our process well.
First, a story to demonstrate a challenge of fundamental investing. Bill Miller and I once had a lunch with an investor in Europe. The fellow bemoaned the fact he couldn’t find any companies that met his investment criteria. He wanted companies with strong growth profiles and cash flow, good returns on capital, excellent management teams and great balance sheets with low valuations. He exclaimed “I can’t find any companies that meet all those criteria!”. Bill chuckled, “Yeah, I want all that too, and can’t find any of those either.”
Market prices reflect fundamentals. If everything is wonderful, valuations reflect that. On the other hand, low valuations generally reflect some perceived problem. Stock prices are driven by revisions to expectations. Our process revolves around this key insight. There are two sides of the equation: the underlying fundamentals and the market expectations. We analyze both. In Expedia, we see a giant disconnect. We think what you pay is far less than what you get.
A value strategy helps you fish in a low expectations pond. Most of the time, you make money when the market changes its view on a perceived issue. Alternatively, people like “growth” or “compounders” because strong business fundamentals can drag intrinsic values higher over time. Ideally, you want elements of both.
Unlike most fundamental investors, who focus almost exclusively on business fundamentals, we first attempt to quantify market expectations. What do we need to believe to make money?
The bar for Expedia is quite low. North America online travel bookings are projected to grow in the low double-digits through 2030. Expedia was growing at about that pace prior to the pandemic. Consensus projects a similar growth rate this year, fading to mid-single digits by the end of the decade. This compares to our estimate of market-implied topline growth of less than 2.5%. Quite the gap!
Why the muted expectations? We believe there are two issues: 1) near-term concerns about recession and 2) fears about market share loss. Expedia lost some market share over the past year as it exited markets and focused its investment on its core brands (Expedia, Hotels.com, VRBO). We think sacrificing share to optimize returns was the right call.
The main point: there’s a wide margin of safety between the market-implied growth rate (2.5%) and that of their underlying market (10%+) as well as sell-side consensus for the company (high single digits).
Expedia is the second largest company in a travel industry oligopoly. It’s competed successfully over many decades. The core brands are strong with stable or growing market share. The company improved its tech-stack and operating platform during the pandemic, which should allow it to innovate more rapidly. Expedia’s business-to-business offering (think Amazon Web Services for independent travel companies) is performing well. Soon Expedia will offer a loyalty program where people can earn points across different types of accommodations (hotels and vacation rentals) – the only company with the ability to do so. It’s recently rolled out a Chat-GPT AI feature on the app.
In our base case, we project only 6% topline growth over the next decade implying market share losses. This results in a stock value of $165 (+76%). The stock is significantly undervalued even if it grows at below market rates! Since we have zero ability to predict the future, we always look at a variety of scenarios. We prefer investments with attractive potential in many scenarios, and with a good risk-reward.
We believe that’s the case with Expedia. We think we will make more money if we’re right than we will lose if we’re wrong. Our bull case value is 4.0x our bear case. Our base case is 1.3x the bear case. We see higher odds of profit than of loss (2.0x higher odds). Details below.

Source: Patient Capital Management, LLC
It’s not often you find a quality company with good growth prospects, a strong balance sheet, good management, and nice free cash flow at such an attractive valuation. We think market concerns about share loss are overdone. We expect the company to grow intrinsic value per share nicely over time and to generate handsome amounts of free cash flow. As it executes, we expect market concerns to dissipate.
Given the depressed valuation, Expedia can opportunistically repurchase stock at prices accretive to intrinsic value. It’s been doing just that. After a decade of languishing returns for value stocks, we like when companies return capital to shareholders. It can act as a forcing function on closing the value gap.
Overall, we remain confident about the portfolio and its prospects. The portfolio mostly consists of opportunities like Expedia and UBS: companies where we see strong fundamentals and cash flow where the market doesn’t accurately reflect the long-term prospects. We have confidence the portfolio can withstand any short-term challenges and deliver strong long-term returns.
We appreciate all the interest and support, and we will work diligently to realize the value we see in the portfolio.
1 https://patientcapitalmanagement.com/articles/the_sp_500_remains_far_below_its_highs._historically_that_is_a_buy_signal
Related Posts
Christina Siegel's 1Q 2023 Market Highlights
Stock prices at time written: April 11, 2023.
The S&P 500 Index (SPX) is a market capitalization-weighted index of 500 widely held common stocks.
The S&P 1500 Index includes stocks in the S&P 500, S&P 400, and S&P 600 and covers approximately 90% of the market capitalization of U.S. stocks.
The S&P 500® Equal Weight Index (EWI) is the equal-weight version of the widely-used S&P 500. The index includes the same constituents as the capitalization weighted S&P 500, but each company in the S&P 500 EWI is allocated a fixed weight - or 0.2% of the index total at each quarterly rebalance.
M2 is the U.S. Federal Reserve’s estimate of the total money supply including all of the cash people have on hand plus all of the money deposited in checking accounts, savings accounts, and other short-term saving vehicles such as certificates of deposit (CDs).
Revisions to expectations refers to expectations investing. Expectations investing represents a fundamental shift from the way professional money managers and individual investors select stocks today. It recognizes that the key to achieving superior investment results is to begin by estimating the performance expectations embedded in the current stock price and then to correctly anticipate revisions in those expectations.
Portfolio Upside to Central Tendency of Value (CTV), is a proprietary calculation based on our assessment of the intrinsic value of individual company holdings currently in the portfolio. Portfolio Upside to CTV refers to the weighted average expected return from each individual company reaching our estimate of intrinsic value fromits current trading price. CTV is a probability-weighted estimate of what we believe is the intrinsic value per share for each individual company currently in the portfolio. As part of this process, we build detailed, long-term company models for a variety of scenarios and use multiple valuation methods, such as discounted cash flow (DCF), comparable company analysis, private market analysis, historicals, liquidation, and LBO analysis. These different valuation methodologies are probability weighted to create our CTV. The analysis embeds both risk and return features and allows comparison across securities. Upside to CTV refers to the expected return from a stock reaching our estimate.
Portfolio holdings and portfolio discussion are for a representative Opportunity Equity account. Holdings discussed may or may not be included in all portfolios subject to account guidelines.
Investors should carefully review and consider the additional disclosures, investor notices, and other information contained elsewhere in this document as well as the Offering Documents prior to making a decision to invest.
All historical financial information is unaudited and shall not be construed as a representation or warranty by us. References to indices and their respective performance data are not intended to imply that the Strategy’s objectives, strategies or investments were comparable to those of the indices in technique, composition or element of risk nor are they intended to imply that the fees or expense structures relating to the Strategy or its affiliates, were comparable to those of the indices; since the indices are unmanaged and cannot be invested in directly.
The performance information depicted herein is not indicative of future results. There can be no assurance that Opportunity Equity's investment objectives will be achieved and a return realized. Returns for periods greater than one year are annualized.
The views expressed in this commentary reflect those of Miller Value Partners portfolio managers as of the date of the commentary. Any views are subject to change at any time based on market or other conditions, and Miller Value Partners disclaims any responsibility to update such views. These views are not intended to be a forecast of future events, a guarantee of future results or investment advice. Because investment decisions are based on numerous factors, these views may not be relied upon as an indication of trading intent on behalf of any portfolio. Any data cited herein is from sources believed to be reliable, but is not guaranteed as to accuracy or completeness
Click for more information on Opportunity Equity and the Opportunity Equity Strategy Composite Performance Disclosure.
©2023 Miller Value Partners, LLC
Share