Most of the weakness cannot be explained by fundamental developments. The specialty pharmaceutical companies, Valeant Pharmaceuticals (VRX) and Endo International (ENDP), which we purchased recently, did face continued headwinds of pricing pressure and some business erosion. However, we believe current expectations fully incorporate these negative developments. We were encouraged by Valeant’s hiring of well-respected pharmaceutical executive and industry veteran Joe Papa. Walgreens, Valeant’s new distribution partner, made positive comments about Joe and the relationship so far. In addition, the guidance reset seems conservative.
Outside of specialty pharma, the decline in long-term interest rates will put some pressure on bank and insurance companies’ earnings, if sustained. Outside of that, we believe the performance of the portfolio reflects more of the market structure issues we’ve discussed previously than it does any change in fundamentals.
The breed of contrarian or counter-cyclical traders seems to be virtually extinct. Prop desks, which would step in to provide liquidity, were a casualty of Dodd-Frank. Specialists, who provided a similar function of stepping into the market to take the other side of a trend gone too far, have been replaced by high frequency and algorithmic trading along with decimalization, which do the opposite.
At the same time, the financial crisis heightened the risk management function over that of return-seeking. Hedge fund investors seek volatility of roughly 5% per year, well below the high teens level equities have averaged over many decades and even below the high single digit level seen by corporate bonds.
Most measures to protect against loss take only a few forms: selling (or not buying) based purely on price (stop losses, waiting for price stability to purchase) or the outright purchase of protection (an explicit cost for the investor and selling pressure on the market when banks hedge), typically on the back of market weakness. Even contrarian investors, like ourselves, have implemented such measures. A very successful and highly esteemed hedge fund manager with a style very similar to ours (long-term, intrinsic-value based, contrarian) implemented automatic stop-losses after the financial crisis. This means he sells based purely on price weakness regardless of fundamentals. Who then is left to take the other side?
Not many people. Estimates are that as much as 70% of equity trading is now price reaction based. This means that 70% of the activity driving stock prices doesn’t reflect fundamentals or long-term business value. It is either reaction to news or price, and mostly just noise.
The Friday after Brexit, the market tanked. The following Monday, it continued its decline. That very day our redemptions spiked, particularly in our offshore fund for International clients. We were forced net sellers at some of the most attractive prices of the year. The S&P gained each of the following four days that week, ending the week 5.1% above Monday’s close, which only annualizes to a whopping 9476% return! Then the S&P went on to reach new all-time highs. So far, selling into that extreme weakness has proven a poor decision.
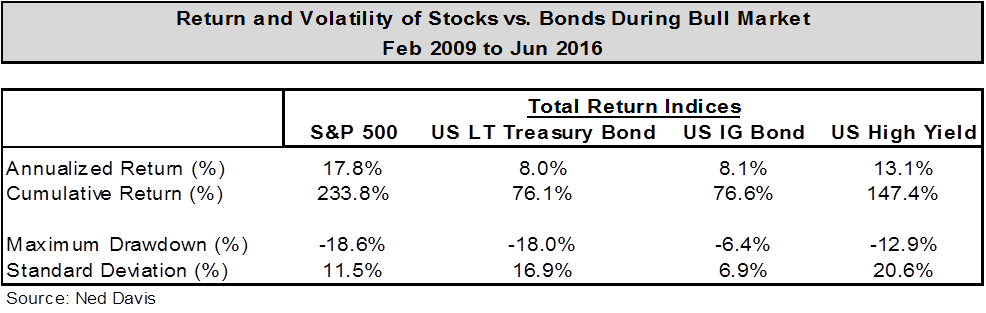
This knee-jerk reaction to protect against losses at any cost is a remnant of the pain leftover from the financial crisis. It is amazing that the emotions are still so tangible despite the massive bull market we’ve had. Stocks have gained 234% (17.8% average annually) since the lows of 2009 massively outpacing long-term average stock returns. They’ve even done it with below average standard deviation (11.5% vs. 18%). This performance crushed long-term US treasuries 76% total return (8.0% annually) with a 16.9% standard deviation. Details are below in Chart 1.
Chart 1
These results haven’t impacted investors’ disdain for equities and appetite for bonds. Equity outflows continue as investors sacrifice return for greater perceived safety. In 2015 and 2016 alone, investors have pulled $167B from equity mutual funds and ETFs while adding $170B to bond funds of the same types.
This is a long winded way of saying security prices and investor appetites can, and do, diverge from underlying fundamentals for long time periods. This, we believe, is what we are seeing with Opportunity Equity. This period reminds us of 2011 in many ways.
The main obvious similarity: European issues are central to fears of a global meltdown. Of course, earlier this year it was China and emerging markets that dominated these headlines. Either way, the result is the same. High beta, cyclical names suffer and valuation provides no support.
It is eerie how similar Opportunity’s current drawdown is to that one. In 2011, Opportunity peaked roughly at the start of the year. It took 9 months to reach the low, but the trough in relative performance to the S&P (just over 3600 bps) occurred after a full year. Most recently, the strategy peaked in July 2015 with the low occurring in February 2016, 7 months later. The relative performance trough was at the end of the second quarter, mostly due to June’s pain. For the 11 month period, the strategy is 3157 bps behind (net of fees)1.
Similar to 2011, there’s a sharp divergence between prices and fundamentals. Airlines may be the best example. They are some of the worst performers and biggest detractors year-to-date. Unit revenue weakness has weighed on the stocks causing bears to contend 1) industry capacity discipline is a farce and/or 2) it’s late cycle and profits will roll over.
We remain believers that the US airline industry is structurally different from what it was prior to consolidation. Every management team is now focused and incentivized on return on capital, which is a big change from the go-go growth days. Capacity discipline remains intact and the companies are highly profitable. All our airline holdings generate significant cash flow and are buying back stock.
This is not to say there isn’t competition. There is, and that’s a good thing. It wasn’t very long ago that people were alleging the airlines were colluding to artificially inflate prices. Now they are going to compete themselves back into bankruptcy. We believe the truth lies somewhere in between.
The airlines have still been reporting record profits, despite unit revenue pressures. This will end this quarter given the rebound in oil prices, but we do think profits will remain healthy. We do not believe a recession is imminent, but even if it is we think the airlines are undervalued in the long-term.
Delta Air Lines (DAL) is the best example. At ~$36, it trades at 6.1x what it’s expected to earn this year. It earned a 32% return on capital (ROIC) for the past 12 months. The company has massively deleveraged and improved profitability. At a recent investor event, they raised all their long-term profit and free cash flow goals. It now expects to sustain 25%+ ROIC, 15% earnings growth and ~$5B free cash flow annually for the next few years. This means it has a 17.7% free cash flow yield. It’s returning a lot of this cash to shareholders. It has a 1.5% dividend yield, which has doubled over the past 1.5 years. They announced they will increase the dividend by 50% later this year. It’s buying back a lot of stock and has gotten more aggressive at lower levels, which is both sensible and unusual. It has committed to buy back $3B over the next year, which equates to more than 10% of shares outstanding at current levels.
But what if the company’s outlook is too optimistic? That’s fine, because it looks cheap even if we’re about to enter a recession. We believe (as does the company) that it will be profitable in the next recession. If it had its current balance sheet in the Great Recession, it would have been close to breakeven excluding merger integration costs. The next recession isn’t likely to be as severe. We estimate it will earn ~$2.50 per share at the trough. So it trades at 14.5x TROUGH earnings, compared to the S&P 500 at 18x CURRENT earnings. Though we don’t foresee a recession, let’s assume 2016 is peak. If we are right about what it will earn in a recession, mid cycle earnings would be ~$4.40. Since it will earn its cost of capital through the cycle, it deserves to trade closer to other high quality industrials at mid-teens multiples implying a value in the mid $60’s. (+80%).
Back to the 2011 analogy: the good news is what happened after 2011. As the market realized things would be ok, the names we owned had a major reversal. Opportunity was up 138% (net of fees)1 over the subsequent 2 years, well ahead of the market’s 54%. While we obviously don’t know the future, we see significant upside in Opportunity Equity. The upside to our assessment of intrinsic value is well into the triple digits, which is an extreme reading and usually portends good future returns.
Given the structural changes in the market, there’s been a trend towards higher volatility and the compression of returns into a shorter period as everyone does the same thing at the same time. This makes it even more difficult to “trend follow” as you are more likely to miss a good portion of the return.
We don’t know when the portfolio’s performance will turn, but we believe it could be very soon. When it does, we think the price-value gap is likely to close quickly. We appreciate your confidence and support.
Read Opportunity Equity's 2Q 2016 Review
1For important additional information on Opportunity Equity strategy performance, please click on the Opportunity Equity GIPS Composite Disclosure. This additional information applies to such performance for all time periods. Past performance is no guarantee of future results.
The views expressed in this report reflect those of the LMM LLC (LMM) strategy’s portfolio manager(s) as of the date of the report. Any views are subject to change at any time based on market or other conditions, and LMM disclaims any responsibility to update such views. The information presented should not be considered a recommendation to purchase or sell any security and should not be relied upon as investment advice. It should not be assumed that any purchase or sale decisions will be profitable or will equal the performance of any security mentioned. Past performance is no guarantee of future results.
©2016 LMM LLC. LMM LLC is owned by Bill Miller and Legg Mason, Inc.
Share