The investment industry has spent decades doing something remarkably similar. Investment risk is inherently difficult to measure and quantify. Volatility isn't. Faced with a concept that couldn’t be directly measured, the industry adopted one that could. That wasn’t an irrational decision, it was a practical one.
Modern Portfolio Theory and the Capital Asset Pricing Model transformed investing by introducing rigorous mathematical frameworks for thinking about risk and return. For the first time, investors had tools that could quantify risk, compare portfolios, and bring greater discipline to investment decisions.
The ability to mathematize investing held broad appeal. It brought rigor and scientific discipline to an industry that had long relied on intuition and judgment. Volatility gradually became more than a useful proxy for risk. It increasingly became the definition of risk itself.
However, the framework rested on an important assumption: that investment returns behave in predictable ways. Years later, mathematician Benoit Mandelbrot demonstrated the assumption’s flaw, noting that markets experience extreme price movements far more often than traditional models predict (e.g- fat tails).
One might expect that revelation to have limited the framework's influence. Instead, its ability to quantify otherwise complex and uncertain decisions proved too compelling. Entire industries emerged around optimizing portfolios using increasingly sophisticated calculations, risk models, and recommendations. Investment advice became more tractable, not because uncertainty had disappeared, but because it had become easier to quantify.
While for short-term investors, volatility may be an appropriate risk framework, temporary price fluctuations matter little for long-term investors. Additionally, if volatility is an effective measure of investment risk, we'd expect its usage to improve investment returns over time. Has it?
Morningstar’s fund ratings place significant weight on volatility, yet numerous studies have found little relationship between Morningstar ratings and future fund performance. In fact, Vanguard found that one-star funds outperformed five-star funds in one study.1
This isn't entirely surprising. Many of the industry's preferred quantitative measures are backward looking and nonstationary. Thus, they look the best after periods of strong performance and the worst after periods of significant underperformance. In practice, they often reinforce one of investing's greatest mistakes: buying high and selling low.
A much better process for selecting funds is to identify strong managers with a robust investment process and invest during periods of temporary underperformance.
The same disconnect also appears at an institutional level. After the financial crisis, many University endowments embraced sophisticated risk models and volatility-based portfolio construction. Yet over the decade through June 2024, endowments earned 6.8% annually on average, falling short of the S&P 500’s 12.8%, the MSCI ACWI’s 9.0% and the 7.7% 60/40 stock/bond portfolio.
Of course, we can’t entirely attribute the shortfall to the risk equals volatility paradigm. But neither does it provide compelling evidence that increasingly sophisticated measures of volatility have consistently translated into better investment outcomes.
Many have started to recognize some of these model’s flaws. Some have shifted toward “downside-capture”, a measure purely of only downside volatility or upside-downside capture, both of which at least recognize the benefit of upside-volatility.
However, higher volatility (including downside volatility) is often a feature, not a flaw, of the market's greatest long-term winners. Our observation as practitioners is that the stock that rise the most also tend to fall the most during market drawdowns.
In hindsight, we know that the FAANG/Mag 7 or Mag 8 became some of the greatest wealth creators in modern market history. If investors had known that outcome in advance, temporary drawdowns would have seemed like a small price to pay.
The stocks averaged a 31.5% return since the end of 2009 (or IPO date if later) through the end of last year, more than doubling the S&P 500’s 14%. (See details in Exhibit A). $10,000 invested in the Mag 8 would be $796,000 today, about ten times greater than $83,000 from an investment in the S&P 500. With the benefit of hindsight, most investors would likely have accepted periods of temporary losses in exchange for that outcome.
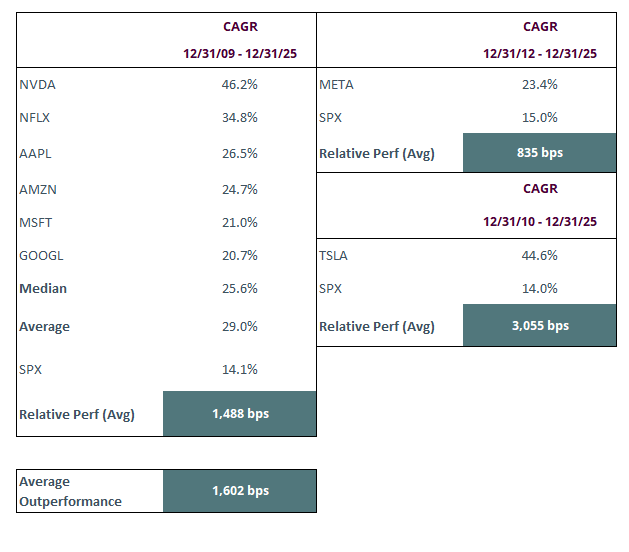
Exhibit A
Those returns came at a cost. This basket almost always experienced deeper drawdowns than the broader market. The Mag 8 underperformed during three of the four largest market selloffs of the past decade. The lone exception was the pandemic, when the sudden shift toward digital services disproportionately benefited many of their business models. Excluding that period, the average drawdown was approximately 1.6 times that of the market’s.
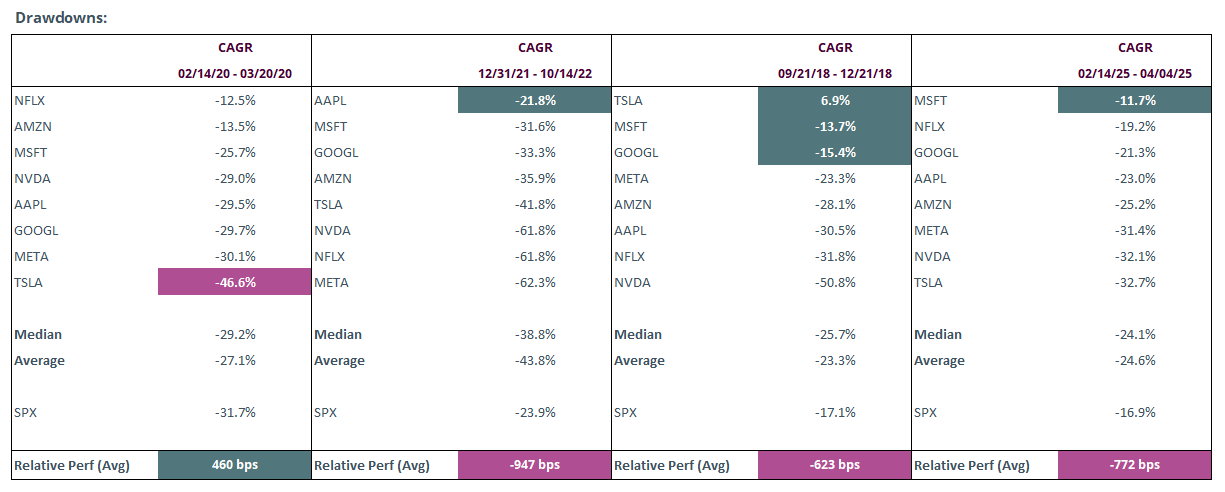
Exhibit B
If the market's greatest long-term wealth creators routinely exhibit the very characteristic we commonly define as risk, perhaps the problem isn't volatility itself. Perhaps it's the definition of risk.
Beta attempts to refine volatility by distinguishing between company-specific fluctuations and movements driven by the broader market. Under the Capital Asset Pricing Model (CAPM), investors should be compensated for accepting greater systematic risk. In theory, higher-beta stocks should therefore deliver higher expected returns.
The academic evidence has generally not supported that prediction. Early work by Black, Jensen and Scholes found that the relationship between beta and returns differed from the predictions of CAPM.3 Later research by Fama and French and Frazzini and Pedersen further challenged the notion that simply buying the highest-beta stocks would reliably produce superior long-term returns.4, 5 The one area where the theory reliably holds is on levered market indices, which do vary one-for-one on the upside and downside with beta’s prediction.
Beta remains a useful measure of market sensitivity, and one that we utilize. But like volatility itself, it describes only one dimension of investment risk. It simply isn’t possible to reliably construct outperforming portfolios by increasing beta, which calls into question it’s usefulness in assessing a fund’s performance.
If volatility isn't risk, then what is? We believe investment risk is the possibility of a permanent loss of capital and the loss of purchasing power, not the day-to-day fluctuations of market prices. As Howard Marks illustrates in Exhibit C, future risk is best understood as a distribution of potential future returns. As that distribution widens, so does the risk.
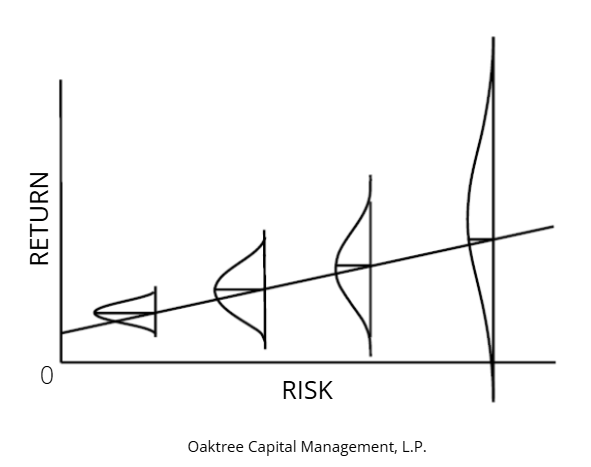
Exhibit C
Our objective is to achieve better long-term returns by making better investment decisions, which means we must be adequately compensated for both uncertainty and risk. Business quality, valuation, competitive position, management decision-making and many other factors impact an investment’s risk.
The pragmatic test of a risk framework’s effectiveness is its ability to improve long-term investment returns. At the end of the day, investors aim to make more money when they are right than they lose when they are wrong. This is effective risk management.
In investing, as in life, the easiest place to look isn't always where you'll find the answer. The ability to measure volatility has made it an indispensable investment tool, but long-term investment success has always depended on seeing beyond what the market makes most visible.
Footnotes:
¹ Philips, Christopher B., and Francis M. Kinniry Jr. Mutual Fund Ratings and Future Performance. Valley Forge, PA: The Vanguard Group, June 2010.
² Bessembinder, Hendrik. “Do Stocks Outperform Treasury Bills?” Journal of Financial Economics 129, no. 3 (2018): 440–457.
³ Black, Fischer, Michael C. Jensen, and Myron Scholes. “The Capital Asset Pricing Model: Some Empirical Tests.” In Studies in the Theory of Capital Markets, edited by Michael C. Jensen, 79–121. New York: Praeger, 1972.
⁴ Fama, Eugene F., and Kenneth R. French. “The Cross-Section of Expected Stock Returns.” The Journal of Finance 47, no. 2 (1992): 427–465.
⁵ Frazzini, Andrea, and Lasse Heje Pedersen. “Betting Against Beta.” Journal of Financial Economics 111, no. 1 (2014): 1–25.
Sources:
Exhibit C. Distribution of Potential Future Returns
Source: Adapted from Howard Marks, The Most Important Thing: Uncommon Sense for the Thoughtful Investor (New York: Columbia Business School Publishing, 2011).
FOR INSTITUTIONAL USE ONLY
The views expressed in this commentary reflect those of Patient Capital Management as of the date of the commentary. Any views are subject to change at any time based on market or other conditions, and Patient Capital Management disclaims any responsibility to update such views. These views are not intended to be a forecast of future events, a guarantee of future results or investment advice. Because investment decisions are based on numerous factors, these views may not be relied upon as an indication of trading intent on behalf of any portfolio. Any data cited herein is from sources believed to be reliable, but is not guaranteed as to accuracy or completeness. The information presented should not be considered a recommendation to purchase or sell any security and should not be relied upon as investment advice. It should not be assumed that any purchase or sale decisions will be profitable or will equal the performance of any security mentioned. References to specific securities are for illustrative purposes only and are not intended as a, solicitation, or recommendation of any particular security or investment strategy.
References to indices and their respective performance data are not intended to imply that the Strategy’s objectives, strategies or investments were comparable to those of the indices in technique, composition or element of risk nor are they intended to imply that the fees or expense structures relating to the Strategy or its affiliates, were comparable to those of the indices; since the indices are unmanaged and cannot be invested in directly.
Any third party links, trademarks, service markets, logos and trade names included in the report are property of their respective owners. Any such references do not constitute endorsement of any product, service, information, or disclaimer presented therein. Patient Capital Management bears no responsibility for any third party data and has no control over third-party terms of use or other policies.
Certain statements included in this presentation, including, without limitation, statements regarding the investment goals, the Firm’s investment strategy, and statements as our beliefs, expectations or opinions are forward-looking statements within the meaning of the relevant securities laws and are subject to numerous known and unknown risks and uncertainties. The factors discussed herein and throughout this presentation could cause actual results and developments to be materially different from those expressed in or implied by such forward-looking statements. Forward-looking statements generally include the use of words such as “believes,” “intends,” “expects,” “anticipated,” “plans,” and similar expressions. Undue reliance should not be placed on these forward-looking statements. Actual results could differ materially from those expressed or implied in the forward-looking statements for many reasons, including the risks described herein. Such statements relate only to events as of the date on which the statements are made and there can be no assurance that future results, levels of activity, performance, or actual achievements will meet these expectations.
The S&P 500 Index (SPX) is a market capitalization-weighted index of 500 widely held common stocks. The MSCI ACWI Index (MSCI ACWI) captures large and mid cap representation across 23 Developed Markets (DM) and 24 Emerging Markets (EM) countries. With 2,460 constituents, the index covers approximately 85% of the global investable equity opportunity. FAANG refers to the five major American Technology companies: Facebook, now Meta (META), Amazon (AMZN), Apple (AAPL), Netflix (NFLX) and Google now Alphabet (GOOGL). Mag 7 refers to the Magnificent 7 stocks are a group of large-cap companies in the technology sector, including Alphabet (GOOGL), Amazon (AMZN), Apple (AAPL), Meta (META), Microsoft (MSFT), Nvidia (NVDA), and Tesla (TSLA) that due to their size and performance accounted for roughly one-third of the S&P 500’s total market capitalization. Mag 8 refers to the Mag 7 securities with the addition of Netflix (NFLX). CAGR refers to the Compound Annual Growth Rate. CAPM refers to the Capital Asset Pricing Model. Beta is a measure of an asset’s price volatility and systematic risk compared to the overall market.
Past performance is no guarantee of future results.
©2026 Patient Capital Management, LLC
Share