Uncertainty spiked in the quarter as the market rode a roller coaster of oscillating tariff policies. The heightened uncertainty flowed through into consumer and corporate sentiment. According to the University of Michigan survey, consumer expectations for business conditions next year hit the lowest reading ever going back to 1977. This is flowing through to propensity to spend, where we see an uptick in personal savings and a decrease in corporate capital spending plans (outside of the AI frenzy of course).
The risk of a rebound in inflation continues to be top of mind. While Core CPI continued to trend down hitting 3.1% YoY in February, US PCE 3-month annualized moved up hitting 2.8% in February. In addition, unemployment is becoming a concern with US employers announcing the largest number of job cuts (excluding 2020) since 2009, with DOGE only accounting for 27%. Unemployment ticked up to 4.1% in February. Together this is creating a tricky setup for the Federal Reserve which unanimously decided to hold rates steady in March at 4.25-4.50%. The market is now expecting 100bps of cuts for the year up from 50bps of cuts at the end of December.
While investors are focused on heightened uncertainty, the market typically has strong forward performance following 10% pullbacks with returns averaging an annual return of 26%, 13% and 12% over the forward 1-yr, 3-yr and 5-yr periods.
-----------------------------------------------------------------------------------------------------------------------------------------------------------------------------
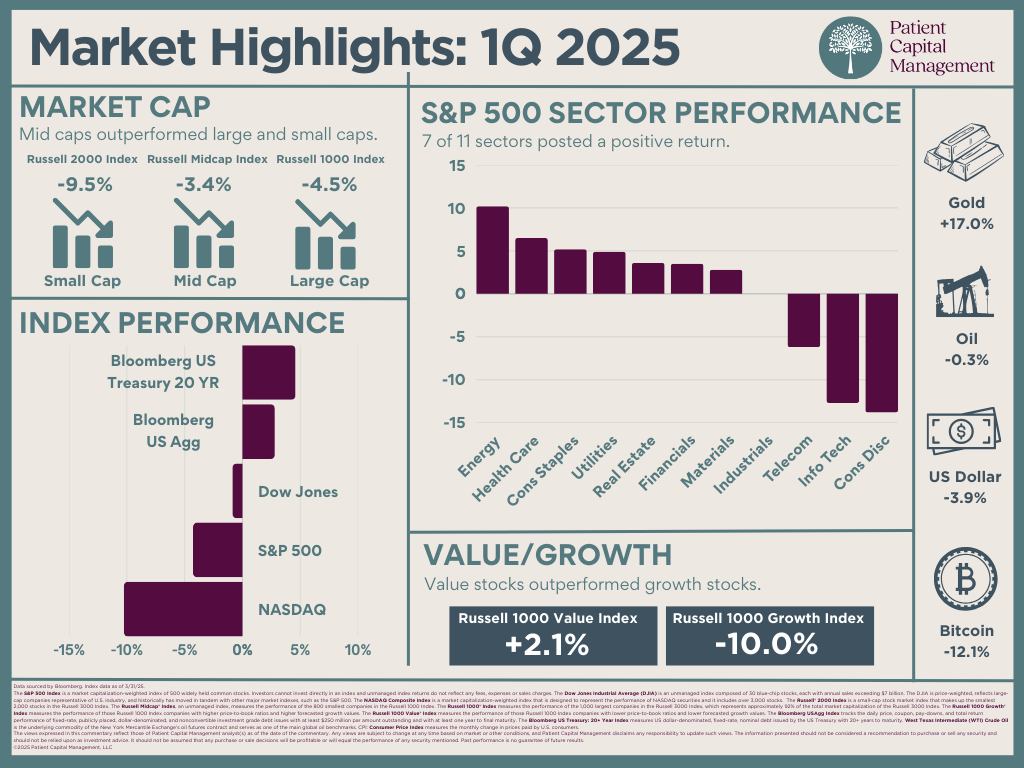
The Nasdaq Composite had the worst performance among major indexes in the quarter, declining 10.3% followed by the S&P500’S 4.3% decline and the Dow Jones Industrial Average’s 0.9% drop. Seven out of the eleven sectors in the S&P500 posted positive returns for the quarter. Energy and Health Care led the market with returns of 10.2% and 6.5%, respectively. Consumer Discretionary and Information Technology were the largest detractors declining 13.8% and 12.7%, respectively.
Small-caps were hit hard in the quarter, underperforming both large-caps and mid-caps. The Russell 2000 declined 9.5% while the Russell 1000 Index lost 4.5% and the Russell Mid-Cap Index posted returns of -3.4%. Value took the lead in the quarter materially outperforming growth, with the Russell 1000 Value Index rising 2.1% while the Russell 1000 Growth Index fell 10.0%.
Bonds provided support in the quarter, outperforming all equity indexes in the period. US 10-year Treasury yields fell from 4.6% to 4.2% in the quarter. Long-dated US Treasures were the standout performer, gaining 4.6% ahead of US Corporates with the Bloomberg Aggregate returning 2.8%.
The US Dollar declined 3.9% in the quarter while Gold gained 17.0%. West Texas Intermediate (WTI) crude remained largely flat in the quarter but is down -14.1% YoY. Unlike gold, Bitcoin declined in the quarter after reaching an all-time-high in January at $106.8k and ended the quarter at $82.4k.
Data sourced by Bloomberg. Index data as of 3/31/25.
The S&P 500 Index is a market capitalization-weighted index of 500 widely held common stocks. Investors cannot invest directly in an index and unmanaged index returns do not reflect any fees, expenses or sales charges. The Dow Jones Industrial Average (DJIA) is an unmanaged index composed of 30 blue-chip stocks, each with annual sales exceeding $7 billion. The DJIA is price-weighted, reflects large-cap companies representative of U.S. industry, and historically has moved in tandem with other major market indexes, such as the S&P 500. The NASDAQ Composite Index is a market capitalization-weighted index that is designed to represent the performance of NASDAQ securities and it includes over 3,000 stocks. The Russell® 2000 Index is a small-cap stock market index that makes up the smallest 2,000 stocks in the Russell 3000 Index. The Russell Midcap® Index, an unmanaged index, measures the performance of the 800 smallest companies in the Russell 1000 Index. The Russell 1000® Index measures the performance of the 1,000 largest companies in the Russell 3000 Index, which represents approximately 92% of the total market capitalization of the Russell 3000 Index. The Russell 1000 Growth® Index measures the performance of those Russell 1000 Index companies with higher price-to-book ratios and higher forecasted growth values. The Russell 1000 Value® Index measures the performance of those Russell 1000 Index companies with lower price-to-book ratios and lower forecasted growth values. The Bloomberg US Treasury: 20+ Year Index measures US dollar-denominated, fixed-rate, nominal debt issued by the US Treasury with 20+ years to maturity. The Bloomberg USAgg Index is a broad-based flagship benchmark that measures the investment grade, US dollar- denominated, fixed-rate taxable bond market. The index includes Treasuries, government-related and corporate securities, MBS (agency fixed-rate pass-throughs), ABS and CMBS (agency and non-agency). West Texas Intermediate (WTI) Crude Oil is the underlying commodity of the New York Mercantile Exchange's oil futures contract and serves as one of the main global oil benchmarks. CPI: Consumer Price Index measures the monthly change in prices paid by U.S. consumers. PCE: Personal consumption expenditures includes a measure of consumer spending on goods and services among households in the US. PCE, CPI, and inflation rates based on available data at the time the piece was written and are not guaranteed to stay the same in the future.
The views expressed in this commentary reflect those of Patient Capital Management analyst(s) as of the date of the commentary. Any views are subject to change at any time based on market or other conditions, and Patient Capital Management disclaims any responsibility to update such views. The information presented should not be considered a recommendation to purchase or sell any security and should not be relied upon as investment advice. It should not be assumed that any purchase or sale decisions will be profitable or will equal the performance of any security mentioned. Past performance is no guarantee of future results.
©2025 Patient Capital Management, LLC
Share