Next thing you know
Shawty got low, low, low, low, low, low, low, low1
An eventful quarter. I went on CNBC for the first time near quarter end (well, excluding the time in college I represented my university’s investment club). Despite Bill’s prior encouragement and some invites, I previously avoided it. I much prefer quietly reading and researching to the limelight of TV! To use the word dread might overstate my feelings, but only a little…
Amazingly, I enjoyed the experience. You might be tempted to think I secretly yearn for attention or have a natural inclination for television. Definitely not. The key: low expectations. The experience so vastly exceeded my and others’ (judging from feedback) expectations, it evoked satisfaction.
This despite notable market weakness, especially at quarter end. After a strong first half, markets fell in the third quarter. The S&P 500 dropped 3.3%. Smaller-cap indices did even worse, with the Russell 2000 losing 5.1%. Opportunity Equity strategy lost 6.0% net of fees in the quarter. Market weakness accelerated to begin the fourth quarter. Year-to-date through quarter end, the strategy gained 17.0% net of fees versus the S&P 500’s 13.1% gain (see performance chart below).
Low expectations have benefits in many realms, including marriage, career, and parenting. We enthusiastically employ a low expectations approach to the markets and investing.
Stock prices follow revisions to market expectations. A low starting point helps. Strong fundamentals do too. The intersection determines stock performance. Good companies can be terrible investments if priced too high. Mediocre companies can do well when expectations are too low. Markets can post strong returns in weak environments, and the riskiest time to invest is when no risks seem evident.
Entering 2023, people feared significant losses and recession. Though first half real GDP growth was slower than the second half of 2022 and inflation remained elevated, the markets surged. Through July, the S&P 500 gained 21%, while the Nasdaq increased 38%. Economic and corporate performance significantly exceeded very muted expectations.
In the pullback since July, investors, already on edge, quickly became pessimistic. Goldman Sachs reported hedge funds’ reduction in net exposure ranked in the 98th percentile of the past 5 years.
The CBOE put-to-call ratio recently rose to 1.97, a rarity that indicates extreme fear. Since 1995, markets subsequently gained in 100% of subsequent 1-year periods with an average gain of 18% according to Tom Lee at Fundstrat. Historically, when the CBOE put-to-call ratio rose over 1 (still extreme), Opportunity Equity gained an average of 28% in the next year.
We see this pullback as a buying opportunity. Most incoming data suggests falling inflation and a strong economy. A Goldilocks scenario we should all want. The risk: if the Fed determines policy based on the strength of the economy, rather than inflation, it risks being too tight, yet another potential policy error. Ever-increasing long-term interest rates pose another risk. We think it’s a good sign interest rates couldn’t sustain their Friday highs after the strong jobs report.
In this environment (like always), we ask ourselves: where are expectations unreasonably low? Where are we confident the window of time is on our side? Our answer may surprise you.
We see many extremely attractive opportunities. Numerous stocks have basement level expectations that we believe will be nicely exceeded over the long term. Low expectations can always get lower but like always, this too shall eventually pass.
We are long-term, value investors. We believe all our holdings are undervalued on a long-term basis. We don’t divide the world into growth stocks vs. value stocks. Growth is an important input in the value equation, as Warren Buffett says. Some of our holdings have low multiples and would be clearly recognized as “value”, while others have higher multiples yet still trade at a discount to our assessment of intrinsic value.
In the current environment, we see more opportunities within the low multiple basket. We believe certain cheaply valued stocks have been left for dead. Unlike the last decade when vast amounts of capital and new technologies threatened disruption, capital is more scarce and mature companies have invested to catch up. From automobile manufacturing to streaming, many legacy players now have competitive offerings.
While the competitive gap has narrowed, the valuation gap has not. The following JP Morgan charts illustrate the point.
The key highlights:
1) The dispersion between highly and lowly valued stocks is more than 20% greater than historical average.
2) The lowest valued stocks recently traded below 10x earnings. Historically, that’s been a good buying opportunity for cheap stocks (2020 pandemic lows, sell offs in 2018/2019, 2011/2012, the financial crisis, the Tech Bubble).
3) Value Index P/Es are below their long-term averages, while Growth Index P/Es are above. The relative difference is at levels we haven’t seen since the Tech Bubble.
We still see the greatest enthusiasm for companies deemed to have the best growth prospects. For good reason. Significant skewness exists in markets. A small number of winners drive most market gains. Except expectations matter greatly. And most stocks priced for greatness achieve far less. When expectations get low enough for any stock, odds of outperformance increase. We see bargain basement expectations for several mature, low multiple companies.
Current disdain for “value” isn’t surprising. We just ended the worst period for value investing ever, in the history of markets2. From 2006-2021, value did worse than the prior worst periods of underperformance: the Tech Bubble and the Nifty Fifty (late 1960’s). Since then, the Russell 1000 Value Index (-8.3%) has outperformed the Russell 1000 Growth Index (-11.5%) by over 300 basis points, even with this year’s “Magnificent Seven”3 dominance.
Following both previous periods, the most cheaply valued stocks outperformed on a sustained and significant basis. Higher real rates also favor companies producing more cash in the near-term. Many companies now return significant amounts of cash to shareholders. We believe this can act as a forcing function for the realization of value.
Recessionary fears pose a short-term headwind for cyclical companies. Many cheaply valued stocks fall in this category. Fortunately, evidence suggests the market already discounts future economic weakness. Take banks as an example. The following chart by Empirical Partners shows that large cap banks trade at their cheapest relative valuations in nearly 50 years. Banks face headwinds, but are they worse than the financial crisis? The biggest banks are also better positioned than their smaller brethren.
The only time relative valuations neared current levels was during the height of the Tech Bubble. Banks subsequently did well, even during a recession and one of the worst bear markets in history. From the peak in March 2000 through the lows three years later, the KBW Bank Index lost 4%, vastly outperforming the S&P 500’s 41% loss or the Russell 2000’s 30% decline. Actual gains required patience. Over the 5-year time horizon with the same starting point, banks gained 40% outperforming the Russell’s 22% gain and smashing the S&P 500’s 15% loss. (Note: we don’t see Tech Bubble type risk anywhere. In 2000, tech multiples peaked at 67x forward earnings and bottomed at 18x, vs. today’s 23x).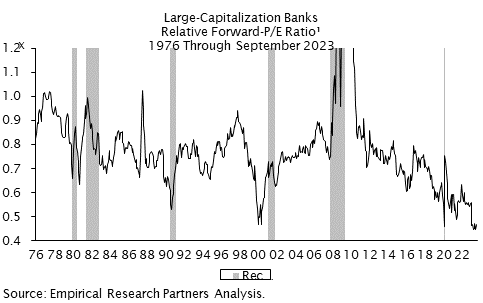
The confluence of passive investing, short time horizons and current market structure creates an opportunity. The popularity of passive investing has grown. It is mostly done on a cap-weighted basis, which allocates dollars to the largest companies irrespective of fundamentals. The top 10 companies in the S&P 500 now account for 32% of its weight, near all-time highs reached during the late 1960’s Nifty Fifty period (34%). Fewer dollars allocated to value strategies mean fewer dollars to close value gaps.
Many investors focus on short-term results. Mutual funds hold stocks less than a year on average. Hedge funds are assessed on monthly performance. Algorithmic funds optimize for holding periods as short as minutes. These investors don’t look through short term weakness with an eye to long-term gain.
Citigroup, which we’ve been adding to, exemplifies the point. The cash-on-cash returns we see are eye-popping. At $39.814, its dividend yield is 5.3% and its total owners’ yield (dividend yield + decline in shares outstanding over past year) is 5.9%. The dividend yield is greater than treasuries or money markets. Citigroup trades at the lowest price-to-tangible book value of the post-Financial Crisis era (see Exhibit A). Even lower than the 2011 Eurozone debt crisis when it still held many problematic assets. Importantly, the balance sheet is now in great shape with no evident issues.
Recent return on tangible equity ticked down as the company deals with duplicative costs to improve its technology and risk controls. Yet the return doesn’t materially differ from the post-financial crisis period when the stock traded at nearly double the tangible book multiple. If it trades back to the median multiple over the next 5 years, that implies 18% annual returns including the dividend.
Exhibit A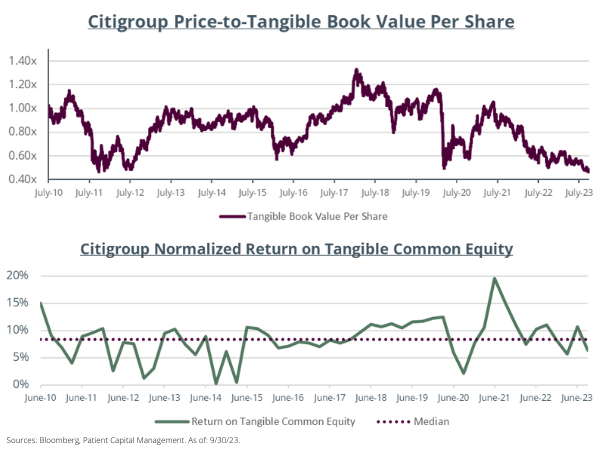
It could potentially do even better. CEO Jane Fraser is executing a plan to improve return on tangible common equity to 11-12% by 2025-2026 (and higher further out). She’s shed underperforming businesses, started simplifying the organizational structure, and invested in technology. If she’s successful, the stock should trade around tangible book, which we estimate will be over $100 per share then, implying annualized returns north of 40%.
Those returns are as attractive as it gets, as good as any “compounder”. We don’t believe they require heroic assumptions, just patience.
Speaking of patience, let’s discuss what it means to be patient in markets. The simplistic answer: to own something for a long duration. Sounds easy enough, but it’s only partially right. It’s easy to own something when it’s doing well. What’s difficult is enduring inevitable periods of poor (and sometimes terrible) performance. The underperformance of value investing has caused some to question its investment merits.
We’ve just ended an era when growth (at nearly any cost) paid off. Value mattered little. The echoes of that mindset endure, but the economics do not. Just like after the tech boom of the 90’s or the commodity boom of the 00’s, it will take time for psychology to catch up with fundamentals.
Back to Citigroup, the stock trades at its lowest price since the pandemic trough when the world shut down. In the depths of that crisis, it hit $32, which would be a 20% loss from here. In the subsequent recovery, Citi traded above $80, up 108% from the current price. It also traded there in 2019. That risk-reward seems highly favorable.
We believe the market’s discounting no chance that Citi can improve its returns. We believe it will succeed. Citigroup has a cost problem, not strategic problem or a balance sheet problem. Management teams have more control over costs. Citigroup’s “supermarket” strategy and organizational complexity made controlling costs difficult historically. They’ve now shifted the strategy and are slimming down.
Even if we’re wrong that Citi will succeed, the stock appears to have little long-term downside. It seems likely the stock can double over the next 3-5 years as economic fears abate, either because we avoid a recession or emerge from one.
Most investors don’t want to stomach near-term pain for long-term gain. In this environment, ~5% yields in cash and bonds satisfy many people. We understand the appeal after a decade of 0% rates, but investors sitting in cash forgo any prospect of capital gains. As Buffett says, it’s best to be greedy when others are fearful.
We like the idea of being paid to wait for better times, but don’t want to sacrifice returns to do so. We see many securities that offer enticing yields plus capital gain potential. As of September 30, our portfolio produced a total owners yield of 4.8% which is greater than the 10-year Treasury and a dividend yield of 2.3% greater than the S&P 500. Details follow on our top 10 holdings:
We own several tech leaders (Amazon, Alphabet, Meta (not shown)) that we believe remain mispriced and will benefit from their significant AI leadership. We like having a mix of different types of mispriced securities. This diversification helps us do well in narrow markets, like this year’s.
Most of our top holdings are cheap, out-of-favor companies where market expectations fall far short of business prospects. You’ll note most of our top holdings combine good fundamentals (returns) with cheap valuations. The few that appear to have lower returns are either turnarounds (C, UBS with Credit Suisse deal) or holding company structures (IAC).
Expedia has an 8% owners yield, mid-to-high teens FCF yield and high returns on capital. It just finished transitioning to a new tech stack and should see benefits over the next year. OneMain has a 10%+ dividend yield, mid-to-high 20% ROE and a price we believe discounts a severe recession. Energy Transfer pays a 9.0% dividend yield, has significant insider buying, and irreproducible energy distribution assets. IAC management has one of the best capital allocation track records in the market. It owns many assets, and the stock reflects little value for stakes outside of its publicly owned company stakes (MGM, ANGI) and cash. I could go on, but you get the idea.
I couldn’t be more excited about this highly differentiated portfolio. We have high conviction in our holdings, and the patience to wait for the market to reflect the value. While we think that will happen in the near-term, it could take longer. In the meantime, we will continue to be patient while also we scour the markets for the best opportunities. We greatly appreciate all our clients’ support.
For more details on our activity and contribution to returns, please refer to the following piece by Christy Siegel Malbon.
Annualized Performance (%) as of 9/30/23
| QTD | YTD | 1-Year | 3-Year | 5-Year | 10-Year | Since Inception (12/30/1999) | |
| Opportunity Equity (gross of fees) | -5.79 | 17.83 | 20.31 | -0.05 | 0.40 | 7.85 | 7.27 |
| Opportunity Equity (net of fees) | -6.03 | 16.96 | 19.13 | -1.04 | -0.60 | 6.78 | 6.21 |
| S&P 500 Index | -3.27 | 13.07 | 21.62 | 10.15 | 9.92 | 11.91 | 6.63 |
1Flo Rida Lyrics
2Closing price on Oct 4, 2023
2Jeremy Siegel, Stocks for the Long Run
3Apple, Alphabet, Meta, Amazon, Microsoft, Nvidia and Teslam
Related Posts
Christina Siegel's 3Q 2023 Market Highlights
Price Source: Bloomberg
The S&P 500 Index (SPX) is a market capitalization-weighted index of 500 widely held common stocks. The NASDAQ Composite Index is a market capitalization-weighted index that is designed to represent the performance of NASDAQ securities and it includes over 3,000 stocks. The Russell® 2000 Index is a small-cap stock market index that makes up the smallest 2,000 stocks in the Russell 3000 Index. The Russell 1000 Growth® Index measures the performance of those Russell 1000 Index companies with higher price-to-book ratios and higher forecasted growth values. The Russell 1000 Value® Index measures the performance of those Russell 1000 Index companies with lower price-to-book ratios and lower forecasted growth values. The KBW Bank Index is designed to track the performance of the leading banks and thrifts that are publicly-traded in the U.S. The Index includes 24 banking stocks representing the large U.S. national money centers, regional banks and thrift institutions.
CBOE Options Exchange is the world's largest options exchange with contracts focusing on individual equities, indexes, and interest rates. Free cash flow (FCF) yield is a financial solvency ratio that compares the free cash flow per share a company is expected to earn against its market value per share. The ratio is calculated by taking the free cash flow per share divided by the current share price. Gross domestic product (GDP) is the total monetary or market value of all the finished goods and services produced within a country’s borders in a specific time period. As a broad measure of overall domestic production, it functions as a comprehensive scorecard of a given country’s economic health. The Nifty Fifty was a group of 50 large-cap stocks on the New York Stock Exchange that were most favored by institutional investors in the 1960s and 1970s.
The information presented should not be considered a recommendation to purchase or sell any security and should not be relied upon as investment advice. It should not be assumed that any purchase or sale decisions will be profitable or will equal the performance of any security mentioned. References to specific securities are for illustrative purposes only. Portfolio composition is shown as of a point in time and is subject to change without notice.
Portfolio holdings and portfolio discussion are for a representative Opportunity Equity account. Holdings discussed may or may not be included in all portfolios subject to account guidelines.
Investors should carefully review and consider the additional disclosures, investor notices, and other information contained elsewhere in this document as well as the Offering Documents prior to making a decision to invest.
All historical financial information is unaudited and shall not be construed as a representation or warranty by us. References to indices and their respective performance data are not intended to imply that the Strategy’s objectives, strategies or investments were comparable to those of the indices in technique, composition or element of risk nor are they intended to imply that the fees or expense structures relating to the Strategy or its affiliates, were comparable to those of the indices; since the indices are unmanaged and cannot be invested in directly.
The performance information depicted herein is not indicative of future results. There can be no assurance that Opportunity Equity's investment objectives will be achieved and a return realized. Returns for periods greater than one year are annualized.
The views expressed in this commentary reflect those of Patient Capital Management portfolio managers as of the date of the commentary. Any views are subject to change at any time based on market or other conditions, and Patient Capital Management disclaims any responsibility to update such views. These views are not intended to be a forecast of future events, a guarantee of future results or investment advice. Because investment decisions are based on numerous factors, these views may not be relied upon as an indication of trading intent on behalf of any portfolio. Any data cited herein is from sources believed to be reliable, but is not guaranteed as to accuracy or completeness
Click for more information on Opportunity Equity and the Opportunity Equity Strategy Composite Performance Disclosure.
©2023 Patient Capital Management, LLC
Share