Part II: Opportunity Equity
The performance of Opportunity Equity in this pullback frustrates us as much as anyone. To lose 19% in January when the companies we own, which started from a point of undervaluation in our opinion, announce positive results overall disappoints us. Though we have no control over short-term price moves, we do use these opportunities to improve the positioning and upside in the strategy overall. We have done this since we began managing the strategy, and it has helped us outperform the market since inception (Opportunity Equity's 5.20% (net of fees) return vs. the market’s 3.73%).1 It also allowed us to post some of our strongest performance coming out of periods of similar weakness.We’ve been asked frequently what names have hurt us the most. The weakness has been broad-based, irrespective of fundamentals or results. The table below (Figure 1) shows our five biggest detractors: Amazon.com Inc (AMZN), Platform Specialty Products Corp. (PAH), Pandora Media Inc. (P), Genworth Financial Inc. (GNW) and MGIC Investment Corp. (MTG).
Figure 1: Top Detractors, as of 2/9/16
| Security | Ticker | Contribution to Return |
| Amazon.com Inc. | AMZN & AMZN C300 1/17 | -6.10% |
| Platform Specialty Products Corp. | PAH | -1.59% |
| Pandora Media Inc. | P | -1.19% |
| Genworth Financial Inc. | GNW | -1.12% |
| MGIC Investment Corp. | MTG | -0.87% |
Losses have been broader than that though. As you can see in Figure 2, just over two-thirds of the portfolio has declined more than 20% with a fifth down 40% or more.
Figure 2: Returns by Groups, as of 2/9/16
| Security | Number of Holdings | % of Total Holdings | 12/31/15 Weight |
| Securities with Returns >-50% | 4 | 7% | 5.9% |
| Securities with Returns >-40% | 3 | 5% | 19.5% |
| Securities with Returns >-30% | 8 | 14% | 29.8% |
| Securities with Returns >-20% | 18 | 32% | 68.5% |
Source: LMM and Bloomberg
We owned some of the strongest performers over the past few years and people sold strength in this decline. A big bank recently informed us they’d seen a lot of short action in the “FANG” group (Facebook, Amazon, Neflix, Google) despite good fundamentals.
Opportunity Equity has also avoided more defensive areas, which we’ve considered expensive, along with the energy, materials and industrials complex, whose fundamentals have been pressured by declining commodity prices and whose valuations still reflect a much more optimistic commodity price outlook than the futures curves imply and we expect. The defensive areas, like utilities and staples, have unsurprisingly posted some of the best performance in the decline, while some cyclical areas that have been hit hard, like materials and industrials, have actually outperformed technology, financials and consumer discretionary where we have big weights. If you combine the impact of our 5 biggest detractors along with the banks, builders and airlines (read more about Delta), it accounts for a loss of 19% through February 9th (Figure 3).
Figure 3: Contribution by Groups, as of 2/9/16
| Industry | Contribution to Return |
| Banks | -3.80% |
| Builders | -2.23% |
| Airlines | -2.08% |
We believe these price declines vastly overstate any impairment of actual business values, providing a great opportunity for long-term investors. I will touch on some of the biggest detractors.
Amazon
We’ve owned Amazon.com, Inc. (AMZN) for more than a decade and a half. It is by far the top contributor to the performance of the strategy since inception. Amazon’s relentless focus on thrilling its customer has allowed it to dominate in a way few other companies do, or ever have. Amazon is one of the best-positioned companies from a competitive advantage standpoint in the market. Amazon continues improve both its retail offering and its Amazon Web Services in order to capture the sizable total addressable market. Management is fabulous: hyper-rational, ambitious, innovative and reliable executors. Periodically, the market will freak out about Amazon’s “lack of profits”. When it did this in 2014, we used it as an opportunity to add to our stake by purchasing long-term call options. Amazon was the top contributor to 2015 performance. Even though we pared back our position considerably through the course of the year, the weight at the end of the year was the highest of any quarter end due to the strength. Amazon’s down 25% year-to-date after announcing a fourth quarter that disappointed slightly on the bottom line. On the back of this decline, the options have declined twice as much (though they are still worth almost triple what we paid just over a year ago). We continue to have complete confidence in the long-term outlook for Amazon. This decline has brought the valuation (based on market value to gross profits, which is the metric that correlates best with the stock) back to levels not seen since the financial crisis -- except late last year when we added to the position. In typical Amazon fashion, they announced a $5.0B share repurchase for the first time since 2010 to capitalize on the weakness. We continue to believe the stock is worth $800, providing significant upside.
Banks
We own three large cap banks: JPMorgan Chase & Co. (JPM) (through the warrants), Bank of America Corporation (BAC) and Citigroup Inc. (C). The banks have been one of the hardest hit groups in the decline. CNBC showed the worst performers from the 52-week highs the other day. Along with energy and materials, whose fundamentals have been decimated by falling commodity prices, were the banks - all down 25-30% from the highs. Unlike those other areas, the banks’ profits have not yet shown any deterioration. What’s weighing down the banks is fear that their profits will soon take a hit. We just don’t think that’s likely. The banks have not taken risk like previous cycles. At the same time, they’ve built massive amounts of capital and are subjected to rigorous stress testing annually.
People do not seem to be quantifying the risk properly. Let’s use Bank of America, which is our largest bank position, to illustrate. Prior to and during the financial crisis, residential loans equaled 26-28% of total loans (loss ratios reached 180bps), while it’s tangible common equity was 2.5% of assets. So losses could easily wipe out equity. Currently, energy and materials loans are ~5% of total loans (loss ratio on all commercial loans is 12bps) while tangible common equity is 7.5%. The situation is entirely different. At the same time, liquidity has grown from 7.5% of assets to 16.8% of assets.
Many banks trade at significant discounts to their tangible book values. Bank of America trades at a ~30% discount to tangible book while Citigroup’s discount is greater than 40%. JPMorgan, the highest quality of the group, trades at a slight premium to tangible book. We expect these book values to continue to grow. While the prospect of a significant increase in rates is currently off the table, the banks should continue to generate significant capital that will be returned to shareholders. If these stocks just returned to their 52-week highs (not a really great period for the banks given low rates, legal issues and trading profit pressures), the upside of our bank holdings would range from 50% to 80%.
Genworth
I want to make sure to touch on Genworth Financial, Inc. (GNW) since we get lots of questions on it. Genworth has been one of our biggest disappointers. We’ve owned it since the financial crisis when we believed it would benefit from a recovery in the markets and its mortgage insurance business. It did and was one of our top performers in 2013. In hindsight, we should have exited at that point. But we believed in the vision and potential of the company. Even at its highs, the stock traded at a deep discount to book value with one of the lowest P/E’s in the market and a path to improving returns on equity and returning capital to shareholders.
When new CEO, Tom McInerny, joined in late 2012, he was tasked with changing the economics of the long-term care business by moving it more towards a health insurance model where risks are regularly repriced, from the life insurance model where you never reprice risk. The company has actually made great progress on this front, but not enough to offset the continued deterioration in the legacy book of business. Lower mortality (people living longer), combined with higher morbidity (disability) have crushed Genworth’s long-term care book. At the same time, a number of constraints have hampered the company’s ability to separate its mortgage insurance business from its life businesses. Most recently, investors have grown concerned about debt maturities coming due from 2018-2021.
After declining more than 50% in 2015, we thought the concerns were fully reflected in the stock. The stock ended the year at $3.73, significantly below the $5.18 level where the CEO had last purchased stock in August. The sum of the pieces of Genworth, some of which trade separately in the public markets, implied values approximately triple the stock price. None of this provided any margin of safety as the stock is down a whopping 58% year-to-date, to levels only breached for a short time in the throes of the financial crisis when it had legitimate liquidity concerns.
The stock traded down significantly after announcing earnings. It took a disappointing charge in its life business to reflect current markets. It also announced a restructuring that will enable the company to separate the long-term care business from the life business. Additionally, it stopped writing life business given competition in that market and the returns it can earn. These announcements clearly set up the company to be able to sell the life insurance business, which it attempted to do last year and found legitimate buyer interest. Ratings concerns ultimately halted the process, but this new structure should take those off the table. I guess the company’s advisor, who thought these announcements might be too positive for the stock, was clearly wrong.
We believe there’s significant embedded value in Genworth, and it is clear management and the Board has placed a great deal of urgency on taking steps in the short-term to improve returns. Even being conservative on our valuation of the company, we get a value more than triple the current price.
•••
These examples are actually some of the ones where there’s been the most “disappointment,” which is not surprising given they are the biggest detractors. Still, it seems like Mr. Market is on a depressive bender seeing only darkness where there is actually light. More broadly, results are even more encouraging. Companies we speak to definitely aren’t seeing the weakness projected by the market. Historical precedent says times like these usually provide great buying opportunities.
In periods of turbulence, we do like to remind our investors that we are in it for the long term. However, in light of recent underperformance, we thought it would be a good exercise to look at past periods with similar selloffs in the strategy. As you can see in the table below, the forward returns are much stronger than overall. When the strategy’s trailing 1-month return was more than -15%, the median forward 1-year return has been 36.5%. When the trailing 3-month return was worse than -15%, the median forward 1-year return has been 32.5%. If you just look at the times where returns were as bad, or worse than current return, the forward 1-year average return was 52.5%. We recognize that past performance is not a guarantee of future performance, but believe that the strategy is positioned to make a similar rebound.
click the image to view larger
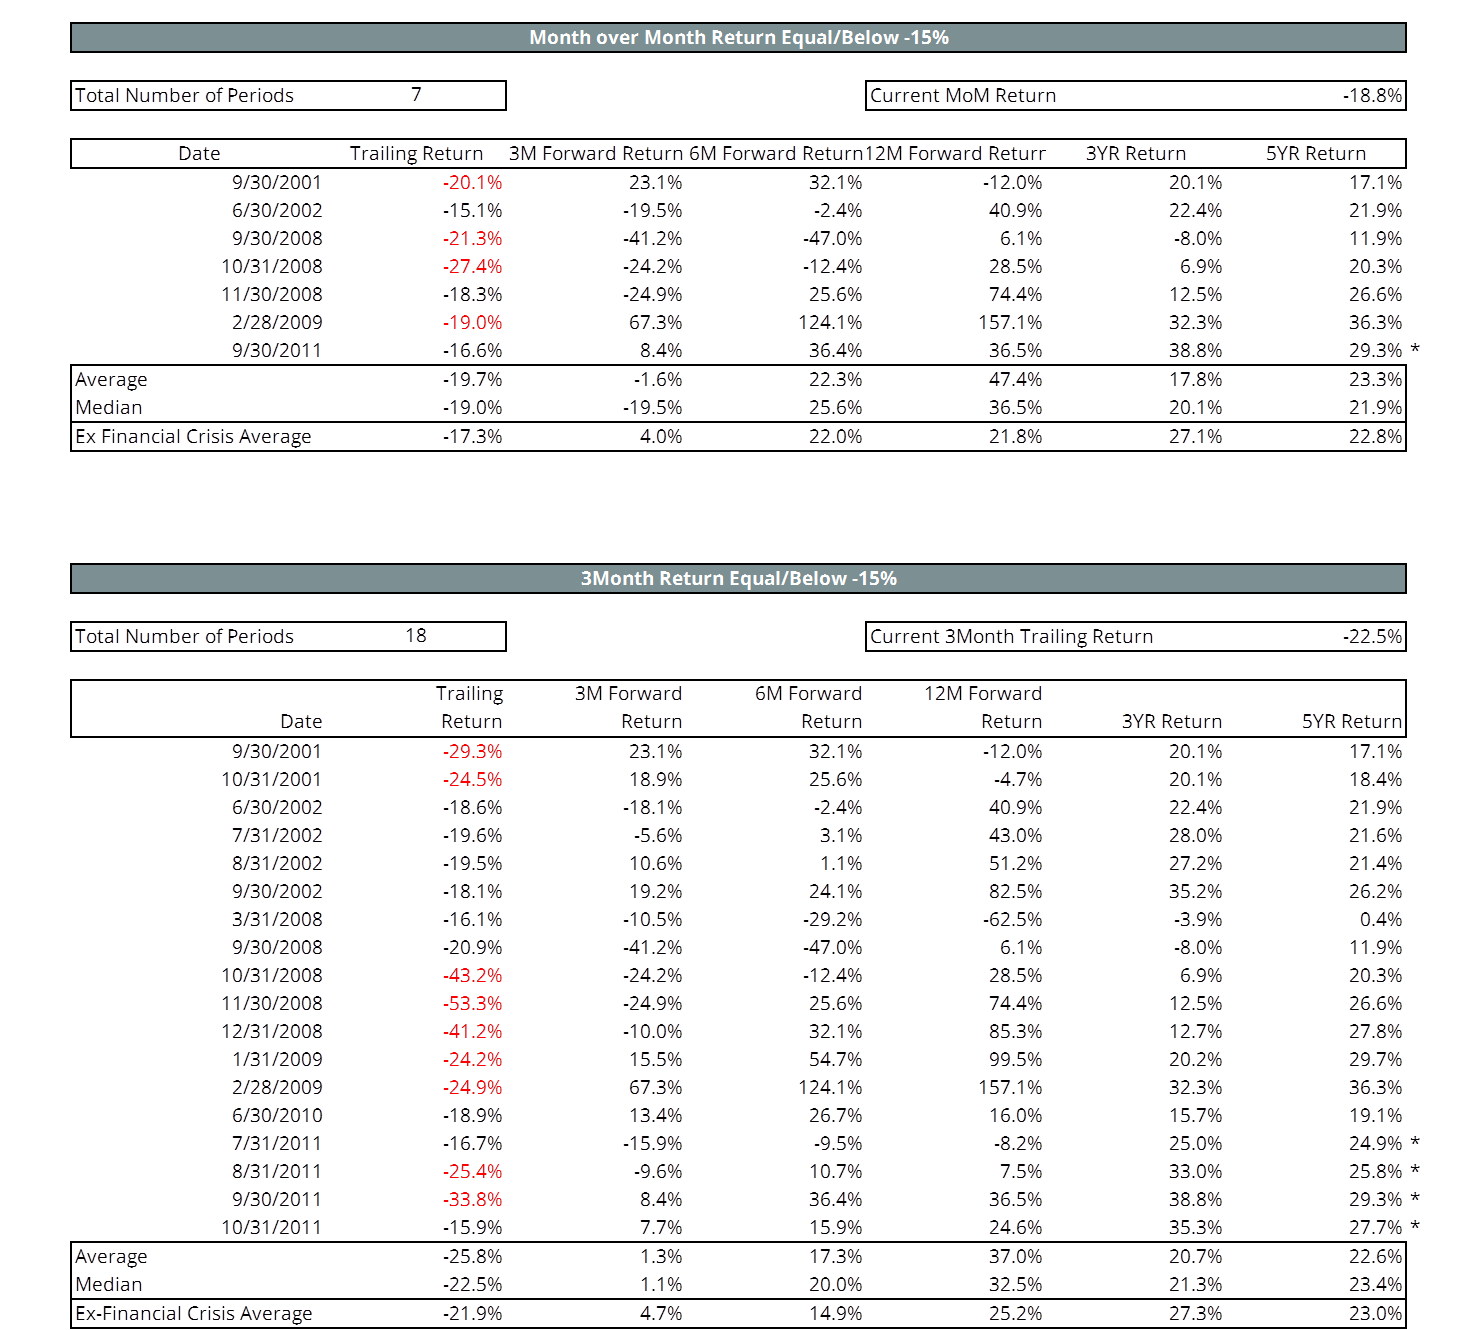
*5-Year numbers are 4-Year due to not having 5-Years worth of data.
The good news is that we can use these market moves to improve the upside in the portfolio and we are. Most recently, the embedded upside in the portfolio (based on our assessment of intrinsic value) exceeded 130% -- it hasn’t been this high in a number of years. We believe this is a better indicator of future returns than the trailing numbers. In our opinion, the current environment seems similar to 2011 when performance suffered, but there were very few true permanent losses of capital. The declines of 2011 led to opportunities we capitalized on enabling us to gain significantly over the following two-year period.2
We appreciate your continued support, and assure you we continue to work hard every day to pursue exceptional investment returns.
Read Part I of this series: “Difficult to see. Always in motion is the future." –Yoda (Star Wars)
For important additional information on Opportunity Equity strategy performance, please click on the Opportunity Equity GIPS Composite Disclosure. This additional information applies to such performance for all time periods. Past performance is no guarantee of future results.
1Performance for period 12/30/1999 - 1/31/2016. 2Opportunity Equity returned 138% net of fees during the two-year period from 1/1/2012 through 12/31/2013.
Contact LMM to obtain information on how Top Contributors and Top Detractors were determined and/or to obtain a list showing every holding's contribution to strategy performance.
Investment Risks: All investments are subject to risk, including the possible loss of principal.
The views expressed in this report reflect those of the LMM LLC (LMM) strategy’s portfolio manager(s) as of the date of the report. Any views are subject to change at any time based on market or other conditions, and LMM disclaims any responsibility to update such views. The information presented should not be considered a recommendation to purchase or sell any security and should not be relied upon as investment advice. It should not be assumed that any purchase or sale decisions will be profitable or will equal the performance of any security mentioned. Past performance is no guarantee of future results, and there is no guarantee dividends will be paid or continued.
©2016 LMM LLC. LMM LLC is owned by Bill Miller and Legg Mason, Inc.
Have some thoughts on this topic?Tell us.
Share