***
In May 1991, Barrie Wigmore, of Goldman Sachs published, “How Can We Explain the Growth of the S&P 500 in the 1980s?” He concluded that earnings and interest rates, “only represented 35% of the growth….”
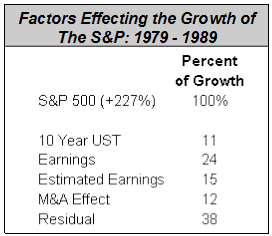
The biggest surprise is probably that “Residual” or X factor which he wrote, “leaves a great deal of room for observers to see whatever they choose….”
If we were to engage in the same exercise for this market, we would attribute 30% or so to central bank activity (including the FRB), earnings and fundamentals a slightly lesser amount and – ultimately – 25% for Wigmore’s “Residual.” (Oil and global political issues have been non-contributors and have probably hurt the market on the order of 10 to 25%).
To us the residual factor is sentiment; viewing the glass as half empty or half full has always been a critical but unappreciated factor in market analysis. It is especially important at critical junctures such as market tops and bottoms as changes in attitudes precede actions and supports our view that market timing can be a profitable exercise.
Timing has always been a controversial issue in part because analysts and traders go to extremes. We do not endorse day-to-day or week-over-week approaches and argue that in the short – medium term, timing is ineffective and expensive. As Exhibit A we might point to the hundreds of anticipated corrections that have been futilely forecast since 2009. While there have been corrections, they were not anticipated at the time. (To note that the market is “toppy” or “due” for a 10% decline does not – in our book – count as a forecast.)
Others have suggested that magazine covers should be monitored – usually as a contrary indicator. One example, where this was helpful, was the cover below which wrote, “what we can learn from the endless pessimism of Wall Street’s biggest bears.” Unfortunately, not much as the market continued to rally.
6/14/10 - S&P 500 1,089.63
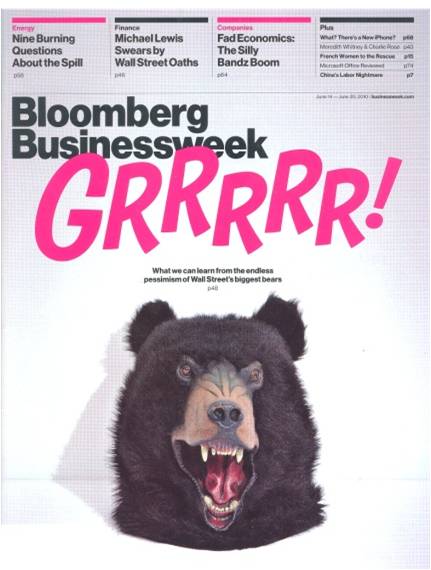
What can we learn from the endless pessimism of Wall Street's biggest bears
Another cover was cited by the bearish community as indicative of a top:
9/23/13 - S&P 1,701.84
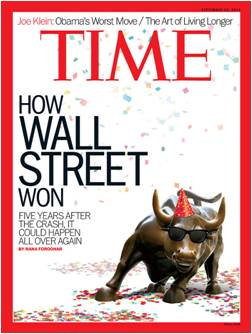
It was not and the story was not about the stock market but about the securities business. And the famous Death of Equities cover was neither bullish nor bearish.
Investors underestimate sentiment in part because it is so readily available. For example, Barron’s regularly publishes a “Big Money” poll while other firms provide surveys and polls of attitudes and outlooks. However, these are not binding and there is no accountability which undermines their credibility of the effort.
Two other measures are regularly (weekly) cited as sentiment: the American Association of Individual Investors (AAII) and the Investors Intelligence (II) newsletter survey.
We have long had significant reservations regarding both. First we question their statistical validity. The AAII has 25,000 members but usually only 500 respond to their weekly survey and sometimes as few as 100+.
As for the II survey we doubt that there is a critical mass of newsletters today. In mid-March, Mark Hulbert, who for years monitored and graded that business announced that he was going out of the newsletter business because of a lack of public interest. We have long suggested that after one subtracts the Fidelity-monitoring letters, the asset allocators, and the politically oriented commentary, there is little in the way of traditional commentary. One client told us that he received five letters on a regular basis. When asked which ones, he listed our publication and four others which he received for no charge from brokers or other services.
Our second concern regarding the above is simply: they don’t work. We won’t do so here but several years ago we charted the AAII results vs the market and found a complete lack of correlation. We then turned the results upside down and challenged clients to tell the difference.
As for the II results, here too analysis is in contrast to the conventional wisdom and application.
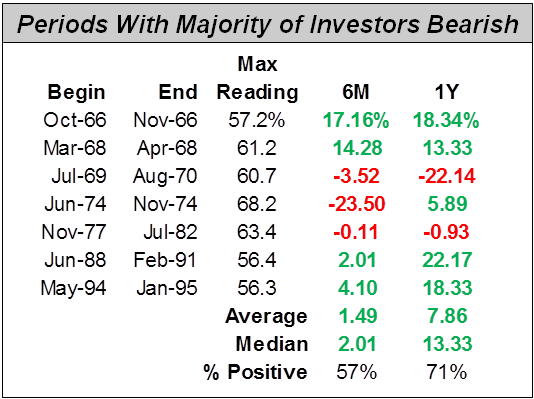
Historically (going back to 1963), there was some limited correlation between that poll and the market. As shown the seven instances of bearish views in excess of 50% for four weeks, the most negative (1974) “forecast” a decline but in five of the seven the market was higher and in four of them, substantially so:
Investors should be aware that both polls are incorporated into market timing models which some researchers provide. Pre-Millennials may remember the old cliché GIGO which concluded that bad inputs lead to bad outputs so we generally ignore those provided by:1
- Merrill Lynch
- Credit Suisse
- BNP Paribas
Our apprehensions notwithstanding, we are proponents of sentiment as a useful indicator. We, however, approach sentiment in an anecdotal, not quantitative, way. Tracking a wide variety of articles, websites, commentary and investor interface, we note headlines, placement and length of stories, sources, data or lack thereof and key words.
Today we are encouraged, as never before in this bull market (or any of our experience) have we seen so many negative attitudes more articulately comfortable. We are continually reminded that we are already there, it is over, we are in a bear market and that it is only a matter of time before the market becomes unraveled:
2/8 Global Stocks on Verge of Bear Market
2/5 Just Admit it, This is a Bear Market
2/25 Smart-beta Guru Now Warning of a Crash
2/25 …Expect Another Global Market Meltdown
3/7 S&P Analyst: Stock Market Geriatric
3/9 …Bull Market Is Bad for You
3/7 Time to Go Short Again: JPMorgan
3/9 Happy Birthday, Bull Market: Write Your Will
3/13 Get Out of Equities in Market Lull
3/15 Don’t Be Fooled by a Bear Market Rally
3/23 Warning: We’re In a Bear-Market Rally
And it is not just the stock market; the economy is also allegedly in trouble:
2/22 Two Signs a Recession Could Be Coming
3/3 JPM: Recession Odds Now 33%
3/26 Recession Sign is in Play; 81% accuracy
2/25 Citi: Here Comes a Global Recession
We stress and detail these factors because they are reminiscent of another period which few analysts and investors would appreciate: 2013. 2013? When the market went up 30%?
Yes, because then too there was skepticism, there was concern and there was confidence on the downside actually beginning in mid-2012.
First there were two lengthy articles in the Financial Times:
Out of Stock (5/24)2
The Cult of Equities is Dead. Long Live Equities. (5/26)
In July: Bill Gross – “Stocks Are Dead” (7/31)
Later that year: Bonds Switch Signals End of Cult of Equity (FT 11/20).
2013 got off to a good start but skepticism abounded. The publisher of Forbes wrote an op-ed: “The Stock Rally That Isn’t” (2/5), Time told us that mutual fund money was flooding into stocks – three years late.
The Financial Times provided a full page summary of market sentiment and detailed that four of the six indicators were in sell mode:
…many believe that signs of froth in the market are a signal that it is time to get out
Although there was only a 3% drawdown in March, analysts for some reason were universally negative:
2/19 S&P Falling to 1,390
2/19 Sell “Aggressively”
2/20 Buy S&P Puts
2/21 Key Reversal Day: “Warning”
2/22 Add Defensive Exposure
2/25 VIX Similar to ’00, ’07 Peaks
2/27 Bullish Newsletters at 11-Week Low
3/4 “Deeper Pullback in March
3/8 …Cracks Below the Surface
Later that summer, even as the S&P had gained 13% in the first half, pessimism persisted:
- Poll: 87% Risk of Stock Crash by Year-End MW 6/5
- Equities: Just a Bear Market Rally FT 7/11
- We Have No New Thoughts. Sell. TS 6/24
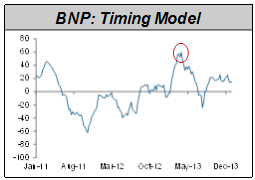
The mood was also reflected in the timing models we referenced earlier. BNP’s was the most bullish in fifteen months which was a contrary forecast and that firm, as we recall, expected a double digit decline.
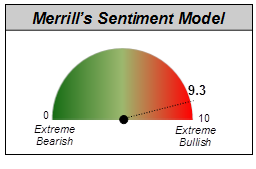
Merrill’s model was likewise “off the charts” at 9.3, a contrary indicator with virtually no chance of a rally.
The negative and outright bearish attitude of many investors and commentators is actually encouraging. We are not for a minute suggesting a replay of 2013, only that the gains since February 11th have – to some degree – been a function of those views.
It is not just polls or surveys which reflect the pessimism, comments and other indicators are likewise at or near extremes:
- Can't See Another Bull Market in My Lifetime (Marc Faber)
- Crude Oil Will Never Trade Back Above $44 'In My Lifetime' (Dennis Gartman)
In addition, this month two more brokerage firms reduced their 2016 forecast while one raised theirs.
The market may have peaked, it may go down from here, and it might eventually trade to 1,704.65 (down 20% from the May 21, 2015 peak of 2,130.82). But the S&P is only 4% from its all-time high and we insist that until it does so it is still a bull market and we are still positive.
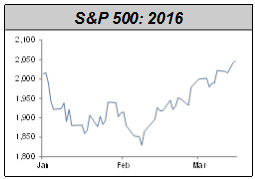
Also disconcerting is the view that we are witnessing a temporary interruption to the down trend and comments such as “don’t chase this market” or “play this rally” are abundant. From the recent low the S&P has gained 12% which is a very handsome move and – more importantly – an opportunity:
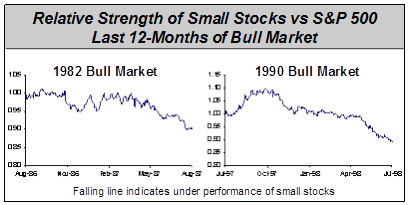
While bears have downplayed the gains, as has been the case since 2009, their concerns are not convincing. One being the underperformance of small stocks which, they argue, shows a lack of breadth and conviction. As we note, almost every month, historical comparisons should be against similar markets, not every market back to 1950 or 1928. If then we restrict our analysis to long bull markets we find instances where small stocks were woeful underperformers.
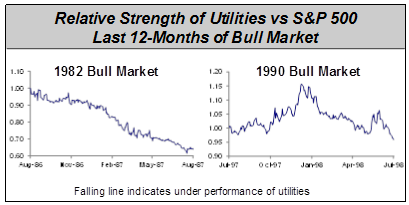
It is also recommended that investors should be defensive in this environment, i.e., buy utilities. But again, a comparison to those periods had investors selling utility stocks:
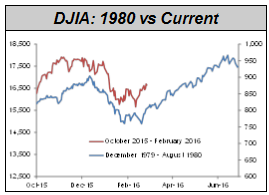
Tom DeMark, a technician better known in institutional circles, “is predicting that stocks are in for a big fall.” While DeMark has made some notable forecasts (especially in the Chinese market) and is regularly reported to consult with some very significant investors, his current view is based on the fact that the market today is “nearly identical” to what we saw last October. This is a superficial approach and one we saw when the ’87 Crash was compared to 1929, then the 2007+ financial crisis was compared to 1929 and more recently (as we noted in February 2014) when DeMark compared then to 1929.
Now DeMark presents three charts which he suggests are ominous parallels to today, one being 1980. That is a curious comparison as the market rallied 19.7% to year end in 1980 (which would bring the DJIA today to 19,918 and the S&P to 2,332).
Another negative concern has been the lack of volume, “Trading Volume Signals Stock Rally Isn’t Sustainable.” We have addressed this from time to time and have never found a metric or tipping point.3 Over time we have collected two dozen books on technical analysis and not one has ever detailed when volume becomes significant only that it is important, supports rallies and should be watched. We have engaged in detailed analysis such as “if a stock goes up 5% on accompanying volume of 5 to 10% what is it likely to do the next three to six months?” We found that sometimes it goes up, sometimes it does not. What about increased price but decreased volume? Interestingly, we found that has a tendency to be more beneficial than increased activity.
Furthermore, there have been a number of reports of Wall Street cutting back in its trading. If that is the case there will be one less participant and volume will recede regardless of investors’ attitudes.
Our continuing negative attitude toward technical analysis was, therefore, bolstered last month and especially because of their continuing lack of investable forecasts. As the market rallied off of the February 11th low we were advised:
- Lows are in ‘For Now’ May Test 1,950 (2/17)
- This is the S&P Level [1,950] Traders are Talking About Now (2/19)
- S&P Rally to Stall at 2,000 (2/22)
- This Chart Level [2,020] Could trip up the S&P (3/10)
- Futures Index Facing Major Resistance [2,050] (3/18)
- Here Are the Key Levels [2,080] That Could End the Stock Market’s Rally (3/21)
Off of the February bottom, 1,950 became the next hurdle. At 1,950, S&P 2,000 was the new “key” number which gave way to 2,050 and so on. For a trader or an investor these numbers were virtually useless as we were never told to buy in expectations of 1,950 or 2,050 nor were we ever advised to sell at 2,000 only that 2,000 was a critical number.
To us and most asset managers, forecasts such as the above are of little use. What does a “test” of 1,950 suggest? That the market will stop there and go down or stall? And if it does stall is it likely to consolidate (go sideways for some time) or go down? Perhaps we are overstating or exaggerating but it is somewhat like a weather forecaster telling us that tomorrow is Wednesday and on Wednesday predicting that the next day is Thursday.
Ultimately there is no change in our view: higher prices and opportunities to make assets grow. No recession, no bear market. The pessimism we have detailed is encouraging especially since so many of those arguments are stale, tired and boring.
One piece we referenced earlier, “Here’s Why the Bull Market Is Bad for You” came from Fortune. The writer is an assistant editor who has written virtually the same piece since 2011 with special emphasis on valuations and CAPE:
8/4/11 The Real Reason Why Stocks are Tanking
2/7/12 Stocks Only Look Cheap
7/8/13 The Party Could Be Over for Stocks
1/13/14 The Dim Future for Stock Prices
7/24/15 Why US Stocks Are Too Pricey to be a Great Investment
Our positive view, however, does not translate into a price target. Oil/energy continues to be a crucial ingredient and influenced by politics, economics as well as fundamentals. With forecasts even today ranging from $60 to $20 we are neither smart enough nor presumptuous enough to provide any reasonable S&P forecast. Furthermore, while the economy has stabilized, we see too much focus on the next retail sales report or the next jobs number.
Some are forecasting 2,300+ or new highs by summer, but here again – as with the bears – the evidence is dubious and unconvincing. One technical analyst noted that there were more stocks hitting 26-week highs. Frankly, we had never heard of six month highs until then.
We are also somewhat underwhelmed by the leadership and nature of the rally. The best performing sector since February 11th has been materials and large gains have been made by stocks like JC Penny, Coach, and Caterpillar. Even IBM, which has missed its revenue target for seventeen straight quarters, is up 8%. This is not necessarily bad but we would rather have some distinct leadership such as health care or financials. So we continue to look for “good pitches” realizing that some “bad pitches” have done well but doubt that Caterpillar will be a good name for the remainder of the year.
Going back to 2013, we hope you will indulge us. We especially remember that year because we were in a distinct minority at the time. In November 2012, Forbes wrote:
Laszlo Birinyi believes 2013 will look quite like 1982 when….the S&P returned 14.8%. By that, Birinyi means you need to be invested in stocks.
***
LMM would like to thank Birinyi Associates for allowing us to republish this piece from their April 2016 Reminiscences newsletter.
1Given the disappointing history of these efforts, we often wonder why the firms do not review and analyze their models. Our view is that if it is broke, fix it.
2The publication carried a banner on page 1.
3Volume. Birinyi Associates, Inc. May 2011.
The views expressed in this report reflect those of the LMM LLC (LMM) strategy’s portfolio manager(s) as of the date of the report. Any views are subject to change at any time based on market or other conditions, and LMM disclaims any responsibility to update such views. The information presented should not be considered a recommendation to purchase or sell any security and should not be relied upon as investment advice. It should not be assumed that any purchase or sale decisions will be profitable or will equal the performance of any security mentioned. Past performance is no guarantee of future results, and there is no guarantee dividends will be paid or continued.
©2016 LMM LLC. LMM LLC is owned by Bill Miller and Legg Mason, Inc.
Share