You can barely read or listen to financial news without hearing about this glorified group of companies that now dominate many passive index funds (~29% of the S&P 500) and account for a substantial part of the market’s return. Some claim their outperformance can’t continue and when it stops, the market might falter. We compare the companies’ business fundamentals to market expectations to analyze opportunities and risks.
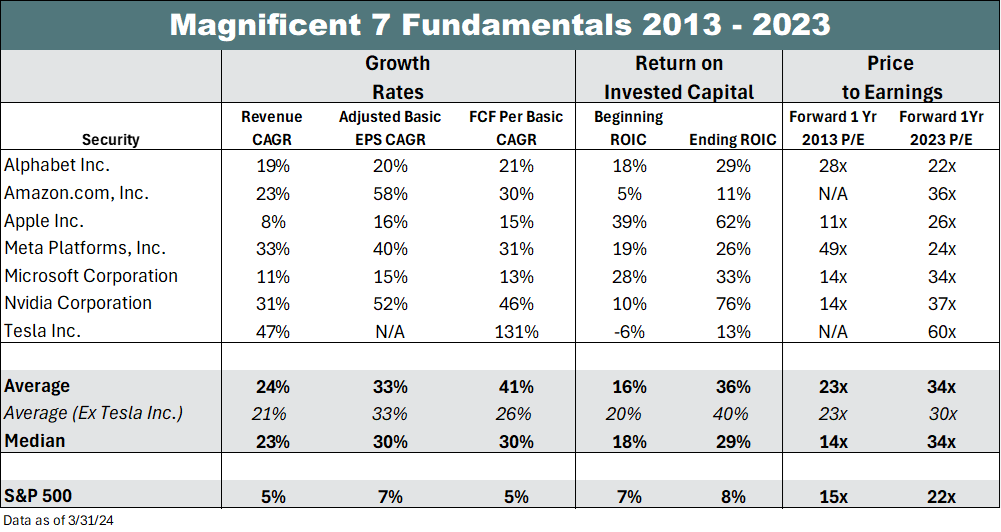 Let’s start with the fundamentals. As shown to the left, these are some of the best businesses ever created, with high returns on capital, giant free cash flow margins and very attractive growth.
Over the past decade, the group has grown revenues 24% per year on average. EPS has grown 33%/yr on average and free cash flow per share growth has been a whopping 41%/yr! Despite significant growth, their returns on capital improved, more than doubling over the past decade! Valuations have expanded on the back of this powerful performance, as you would expect. But excluding Tesla, the average P/E has expanded seven multiple points, from 23x to 30x (in-line with the Russell 1000 Growth’s 29x). More notable is that the “Mag 6’s” relative multiple has compressed. In 2013, they traded at 1.5x the market multiple vs. 1.36x today. With growth rates, free cash flow margins and returns on capital many multiples of the market’s, the premium seems reasonable (possibly even too low!).
 How the stocks do from here entirely depends on the future.
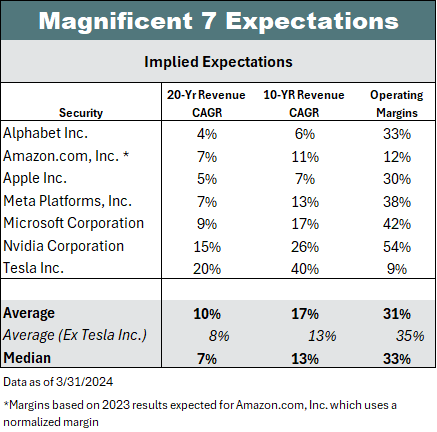
 Since stock prices follow revisions to market expectations, we analyzed market-implied expectations to determine the bogey. With 20-year competitive advantage periods, at last year’s operating margins (except for Amazon which we normalize at 12%), we estimate the group prices in 10% revenue growth and 8% excluding Tesla. If you think 20 years is too aggressive, the 10-year numbers are 17% and 13% excluding Tesla. This compares to a 3-year consensus estimate averages of 16% (14% median). Isn’t Ms. Market amazing (see what I did there)? She’s roughly pricing in exactly what we are currently experiencing over a 10-year horizon, which is not unusual.
We find opportunities where we think market expectations are wrong. Here’s are our conclusions:
- Amazon’s topline expectations seem too low. We think its’ competitive advantage period is longer than 10 years, and maybe even 20 years. Normalized margins could likely be higher at scale too.
- Alphabet is priced to grow topline at less than half (6%) the 3-year consensus rate (14%) due to competitive concerns. We think Alphabet can and will compete and adapt given its technological and scale advantages, and history of adapting.
- Nvidia. You may be surprised to learn we bought Nvidia in the quarter. We did so early in the quarter at a mid-$550’s price. We believe that Nvidia’s competitive advantages (constrained hardware supply, software development platform, accelerated innovation cycles) give it platform advantages in the early stages of an accelerated computing revolution. We see more similarities to Microsoft than Cisco. While that wasn’t priced in when we bought it, it is now! We estimate that the market’s currently pricing Nvidia for Microsoft-like fundamentals over the next 20-years.1 Most companies cannot meet those expectations, but Nvidia might.
- Tesla’s expectations are the only ones that appear aggressive to us. It’s difficult to justify Tesla’s expectations on the current business with today’s penetration of full self-driving (FSD) of less than 10% and operating margins in the high single digits (like legacy auto manufacturers). Over a 20-year horizon, you need to believe TSLA can grow topline 15% per year with terminal operating margins of 22% (implying deliveries 3x Toyota’s with 30% FSD). Alternatively, you need to believe in (and pay for) autonomy. Market expectations are disconnected from the current reality.
- Meta, Microsoft and Apple seem reasonable. We own Meta and are letting our winner run. Apple prices in higher growth expectations than the 3-year consensus (4%). Given its brand and pricing power, it doesn’t seem unreasonable that it could achieve a topline growth rate of 5% over the next 20 years if it sustains its market position. Microsoft is expected to achieve over the next 20 years roughly what it’s achieved over the last 10 years (1-2 points lower growth).
1 We assume consensus numbers for FY25 then revenue growth falls to 11.5% for the next 19 yrs with 42% operating margins (MSFT level) and MSFT’s WACC
Data Sources: Bloomberg, Patient Capital Management, Company Filings
Magnificent 7 is a group of stocks made up of mega-cap stocks Apple (AAPL), Alphabet (GOOGL), Microsoft (MSFT), Amazon.com (AMZN), Meta Platforms (META), Tesla (TSLA) and Nvidia (NVDA). The S&P 500 Index is a market capitalization-weighted index of 500 widely held common stocks. Investors cannot invest directly in an index and unmanaged index returns do not reflect any fees, expenses or sales charges. The Russell 1000 Growth® Index measures the performance of those Russell 1000 Index companies with higher price-to-book ratios and higher forecasted growth values. Earnings per share (EPS) is a company's net income subtracted by preferred dividends and then divided by the average number of common shares outstanding. Price-to-earnings Ratio (P/E Ratio) is the weighted average of the price/earnings ratios of the equities held. Compound annual growth rate (CAGR) is the mean annual growth rate of an investment over a specified period of time longer than one year. Return on investment (ROI) is a ratio that measures the profitability of an investment by comparing the gain or loss to its cost.
The information presented should not be considered a recommendation to purchase or sell any security and should not be relied upon as investment advice. It should not be assumed that any purchase or sale decisions will be profitable or will equal the performance of any security mentioned. References to specific securities are for illustrative purposes only. Portfolio composition is shown as of a point in time and is subject to change without notice.
All historical financial information is unaudited and shall not be construed as a representation or warranty by us. References to indices and their respective performance data are not intended to imply that the Strategy’s objectives, strategies or investments were comparable to those of the indices in technique, composition or element of risk nor are they intended to imply that the fees or expense structures relating to the Strategy or its affiliates, were comparable to those of the indices; since the indices are unmanaged and cannot be invested in directly.
Past performance and does not guarantee future results
The views expressed in this commentary reflect those of Patient Capital Management portfolio managers as of the date of the commentary. Any views are subject to change at any time based on market or other conditions, and Patient Capital Management disclaims any responsibility to update such views. These views are not intended to be a forecast of future events, a guarantee of future results or investment advice. Because investment decisions are based on numerous factors, these views may not be relied upon as an indication of trading intent on behalf of any portfolio. Any data cited herein is from sources believed to be reliable, but is not guaranteed as to accuracy or completeness.
©2024 Patient Capital Management, LLC
Share