“You're only going to get three or four of these invitations to the pie counter, and when you get your invitation, for God's sakes, don't take a small helping." ~Charlie Munger
The Opportunity Equity Strategy gained 4.32% net in the quarter, beating the benchmark S&P 500’s 2.30% return. For the year-to-date, the fund gained 14.93% net vs. the S&P 500’s 12.75%. $10,000 invested in the Strategy at its 2000 inception would be worth over $91,500 at quarter end versus $85,080 invested in the index. Since I took over sole management at the end of 2022, Opportunity Equity Strategy has produced annualized gains of 29.0% vs. the S&P 500’s 21.8%.
Our main contributors for the quarter were Precigen (PGEN $7.60), Meta (META $720.89) and the crypto related holdings (through Fidelity Wise Origin Bitcoin Fund (FBTC $71.08)1 and Coinbase (COIN $172.00), which contributed 693bps gross. Precigen’s successful Papzimeous launch beat expectations and the FDA granted its Adenoverse technology platform status. Meta’s launch of its Muse agents led the market to revise its expectations for prospective returns from its AI investments. Bitcoin’s price bottomed in July. We added to all these holdings on weakness earlier this year, including initiating a Meta option position in the third quarter before the stock rebounded. We remain optimistic about all of them.
Our main detractors in the quarter fell into three buckets: rate sensitive names (QXO (QXO $11.12), banks and financials Citigroup (C $128.08), UBS Group (UBS $47.06), SoFi (SOFI $15.61) and OneMain (OMF $56.42), oil sensitive names (airlines Delta (DAL $82.14) and United (UAL $107.44) and cruise line Norwegian (NCLH $15.49), and managed care companies (UnitedHealth (UNH $370.95) and CVS (CVS $87.80)) that pulled back from second quarter strength. Together, these detracted 572bps gross.
Long term interest rates rose aggressively in the quarter. The US 10-year Treasury recently touched 5.3%, up over 80bps or 18% from the lows of last quarter. The move was even more pronounced across developed markets, where yields rose by an average of 25% from their recent lows. Since late June, the correlation between rising oil prices and rising rates prices has been above 60%, suggesting oil is the proximate cause of the move.
The market’s been resilient, all things considered. We’ve long viewed a dramatic increase in rates as a risk factor, though we think it’s creating some very attractive long-term opportunities.
In Jorge Luis Borges's short story, The Garden of Forking Paths, a Chinese scholar creates a seemingly nonsensical novel in which events contradict one another, characters die and reappear, and the story follows multiple paths. It turns out the novel is a labyrinth of time. At every juncture, the future branches into different possibilities. Rather than choosing one path, the story follows many of them. “Time forks perpetually toward innumerable futures.”
Investing is a lot like navigating Borges's labyrinth, except we only experience one path. Looking backward, the course of events seems obvious, even inevitable. Looking forward, the possibilities are endless. We underestimate how differently things could have unfolded. We overestimate our ability to predict what comes next.
We believe we're in the later stages of one of the longest and strongest bull markets in history. Since the lows in March 2009, the S&P 500 has compounded at 16.9% per year (Opp Strategy at 18.7%), well above the long-term average of ~10%. During the depths of the crisis, few foresaw this particular path.
The final years of a secular bull market are often some of the strongest. This time is no different, with the S&P up close to 22% per year for the past 3.75 years. We don't know whether “final” means we have another six months or seven years to run. We’re focused on optimizing our risk and return across all future scenarios.
The AI revolution adds another dimension of uncertainty. Its accomplishments are already extraordinary, and its transformation potential is enormous (Check out Appendix 1 for an AI co-created recap). Yet there are countless ways the future could unfold, with vastly different implications for companies, industries, and investors.
Fortunately, successful investing doesn't require knowing which path the future will take. What matters is understanding the expectations reflected in prices and evaluating prospective returns across a range of possible outcomes. The future will inevitably surprise us.
Our goal is to own investments where the range of outcomes is attractive enough that we don't need everything to go right. Recognizing uncertainty doesn't mean we should shy away from opportunity. As Munger reminds us, when we find a favorable risk reward where we can make a lot of money and only lose a little, we should act decisively.
Investor skepticism about AI remains high. Everyday there’s a new bubble call. Just this week, Ray Dalio warned that the “classic bubble” is close to popping. He's been warning of an AI bubble since January 2025. Since then, Micron has risen tenfold, Nvidia has doubled, and the S&P 500 has gained 30%. Apparently, the bubble hasn't gotten the memo.
The doomsaying has helped keep a lid on valuations. The S&P 500’s forward P/E multiple has declined to 19x from 23x last year. Growth and quality valuations, which were excessive a few years ago, have normalized.
At its peak in 2000, Cisco traded at 127x next 12-month earnings. Nvidia’s current forward price-to-earnings multiple sits at 19.6x, while Micron’s is at 6.3x. So far, earnings at those companies continue to exceed estimates due to the powerful combination of accelerating revenue growth and margin expansion.
The market is a complex adaptive system. Investors learn from history, and those lessons influence their behavior and the prices they're willing to pay. The widespread fear of another Tech Bubble is likely one reason today's valuations look so different from 2000.
The main risk for AI companies is earnings’ durability. When we bought Nvidia (NVDA $237.47) in early 2024 in the $50s, people questioned whether surging profits were sustainable. Its fiscal 2027 revenues of $410B, operating income of $269B, and free cash flow of $186B will be 7-8x higher than when durability questions first arose. Operating margins that many believed were at peak levels in the mid-50%’s have since expanded into the mid-60%’s.
I don’t recall any forecasts whose bullishness matched reality. Don’t get us wrong, earnings durability is a real risk. It’s just not one that should prevent investors from what might be the most important behavior of all: letting winners run (for as long as the risk-reward remains sound).
Cisco had an earnings down cycle after the Tech Bubble, but it only took three years for profits to exceed the prior peak after the bust. Given Nvidia’s current valuation, that scenario would be bullish. Of course, we don’t know if Cisco’s trajectory is a good guide. It's one of many paths through Borges's market labyrinth.
To gauge the risk, we closely monitor the supply-demand balance of AI computing capacity, which we think is the most important driver of earnings. The signal amidst much noise. Shortages have led to powerful earnings’ tailwinds. Given valuations remain anchored, stock prospects depend on where earnings go from here. Shortages appear set to continue.
If we turn out wrong about the durability, the secular bull market would likely be at risk. Historically, secular bull market peaks (1972, 2000) were followed by markets where value performed well. Importantly, today's market largely lacks the extreme growth stock valuations that characterized prior secular peaks. Nonetheless, we are remaining extraordinarily disciplined on valuation.
The volatility caused by rates is leading to some of the most attractive individual opportunities we've seen in years. In fact, our portfolio is more concentrated in our top ten holdings than it's been in over a decade, as we’ve aggressively added to weak names where the market’s knee-jerk reaction to rates misses the longer-term fundamental pictures (eg – QXO and Chime).
Our conviction isn't based on knowing which path the future will take, but on the attractive prospective returns we see across a range of plausible outcomes.
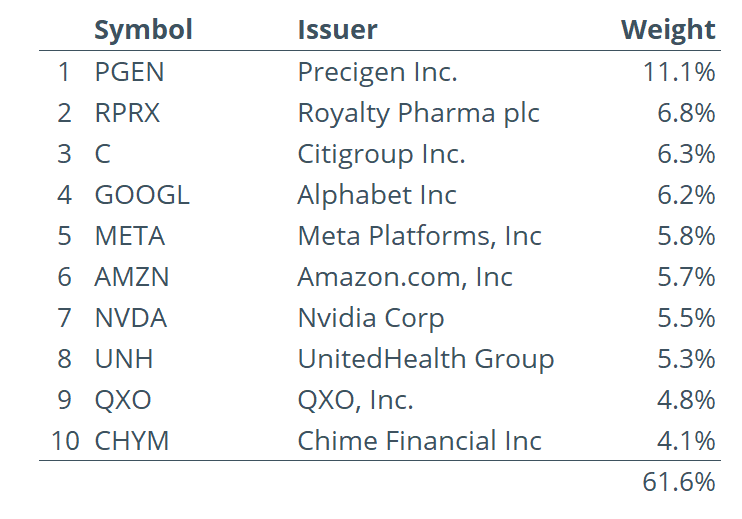
Top 10 holdings by Issuer in the Opportunity Equity Strategy as of 9/30/26.
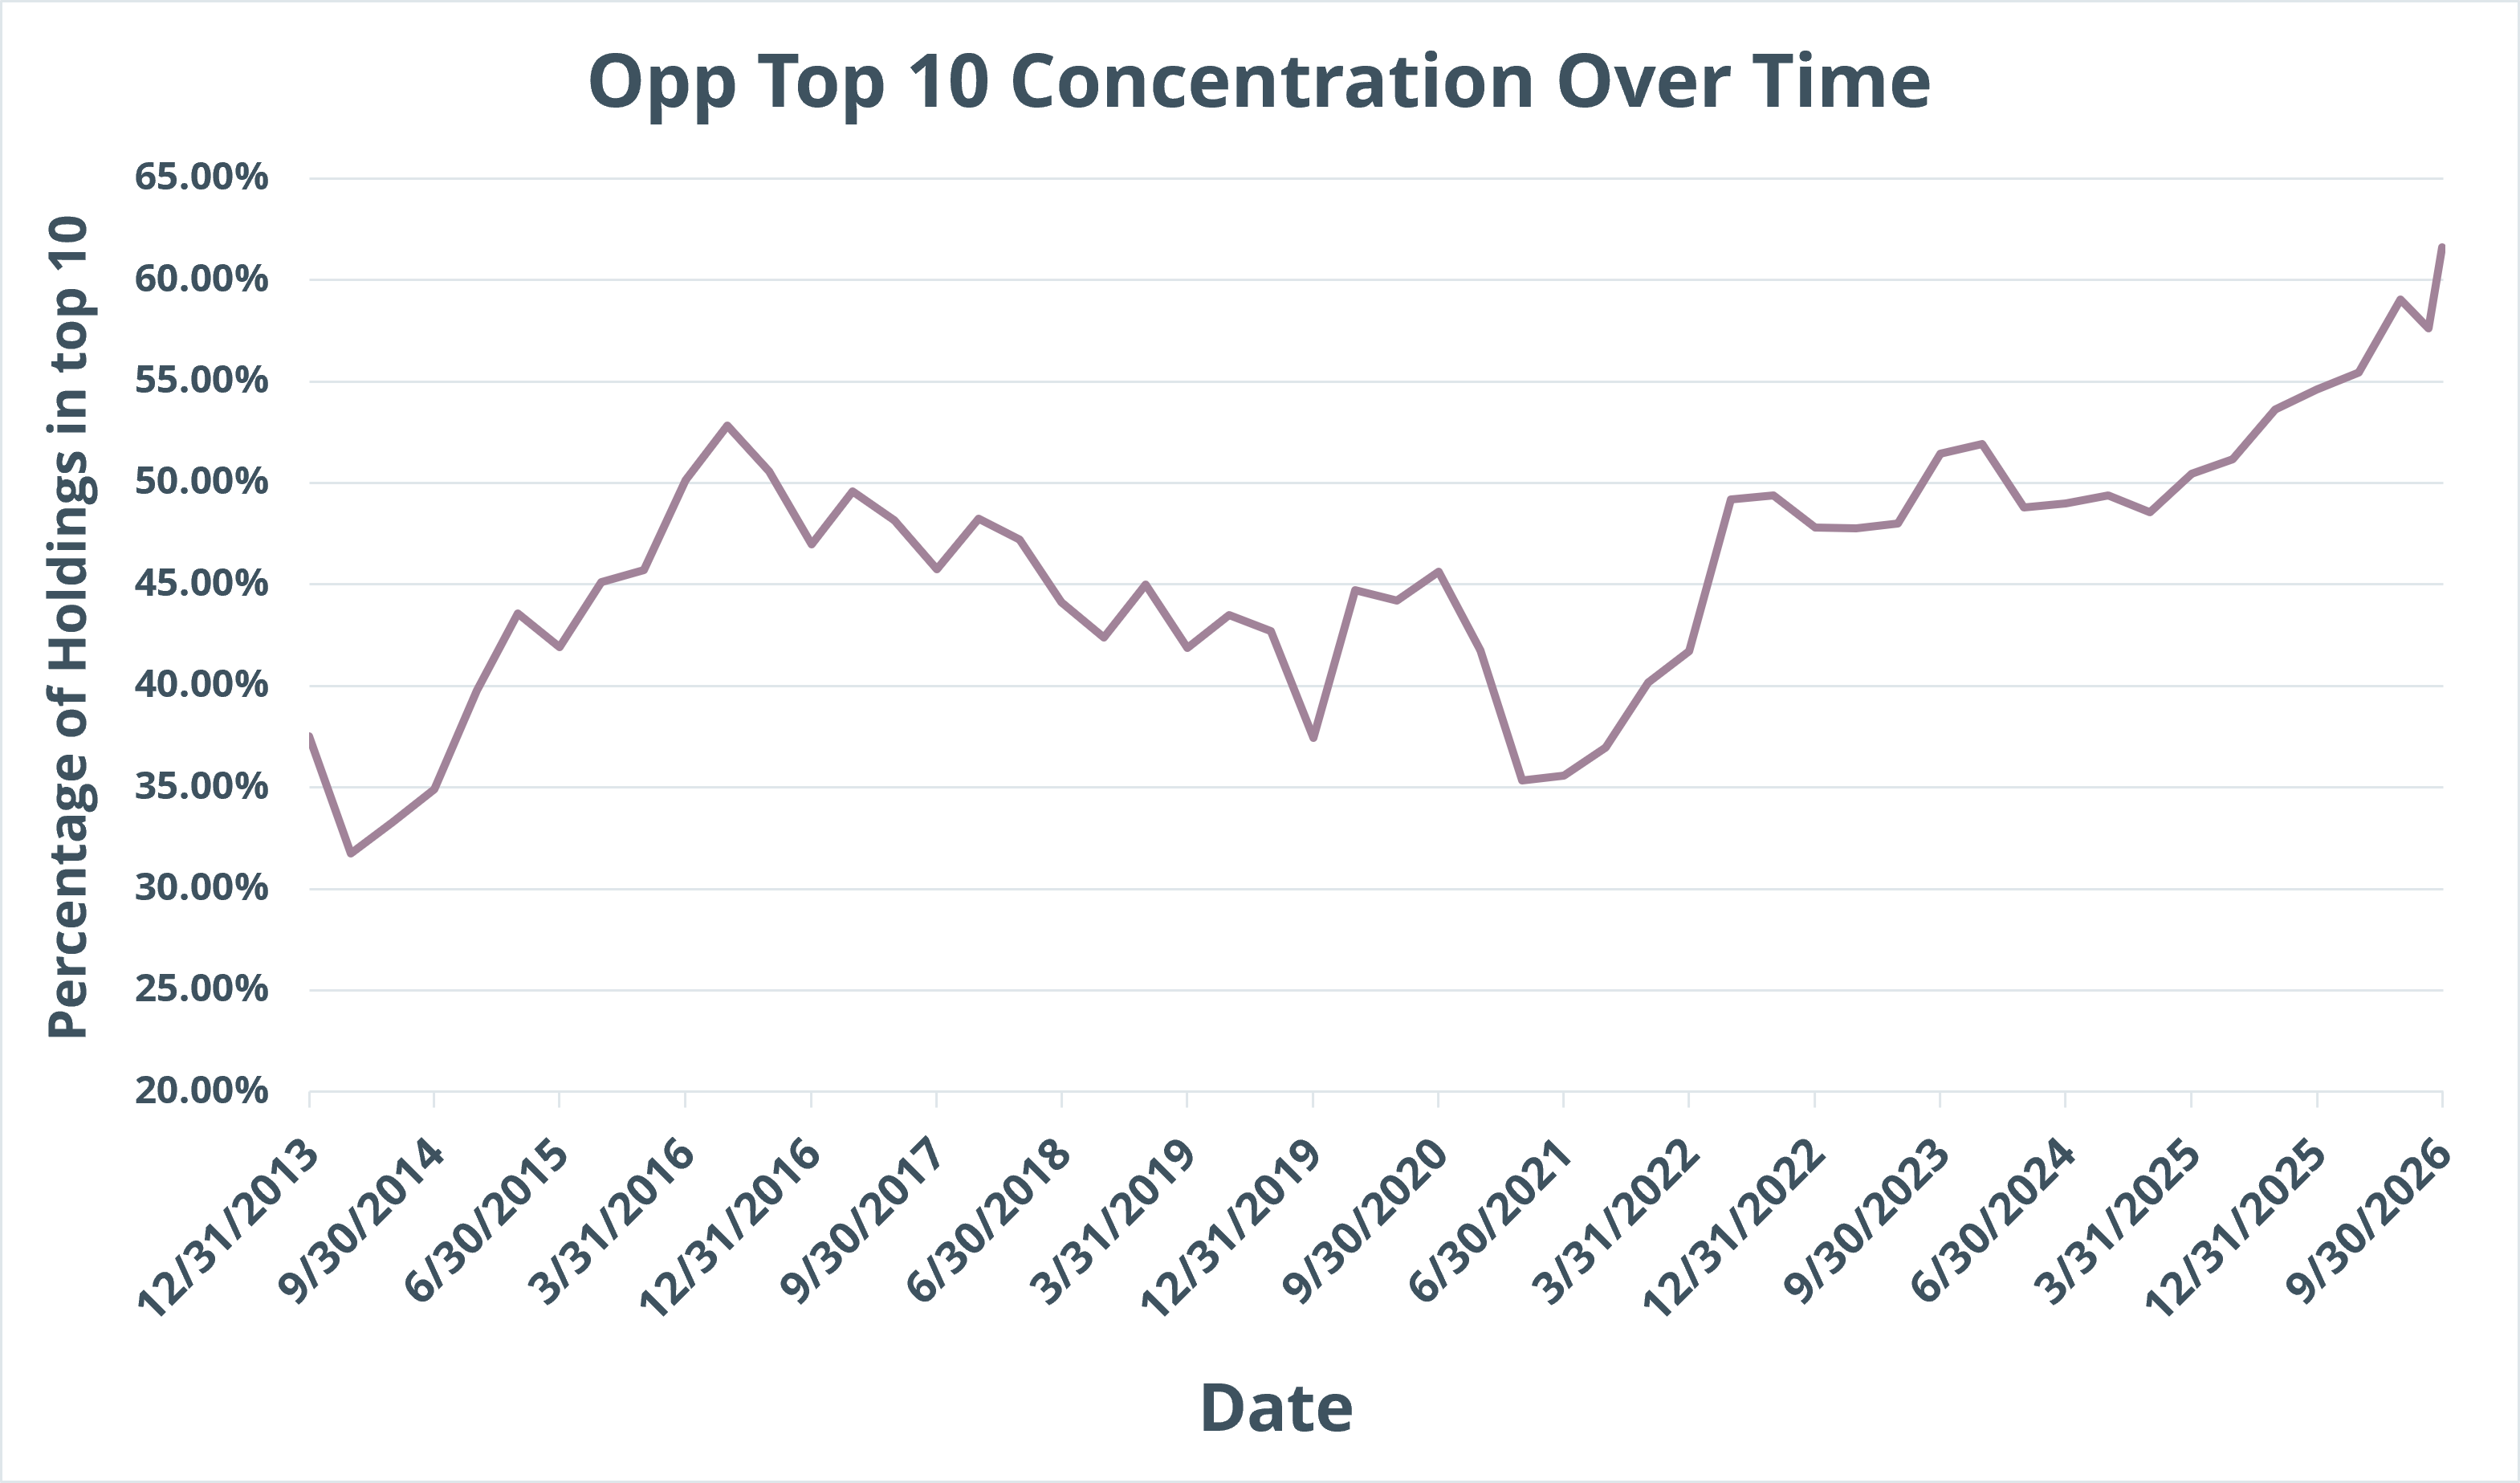
Chart depicts portfolio concentration percentage in the Top 10 holdings for the Opportunity Equity Strategy from 12/2013 – 9/30/2026.
Source: PCM Internal Estimates, Bloomberg
I’m going to start with QXO (QXO $11.12), which we’ve been aggressively adding to on significant stock weakness. The stock has been crushed, down 61% from its highs earlier this year as the building products space sold off on rising rates. CEO Brad Jacobs is a serial entrepreneur with a fabulous track record. When his other companies had drawdowns, it was always a buying opportunity. Those stocks compounded at an average return of ~40% from the drawdown through the end of his tenure. We’ve increased our common equity position by over 70% since the end of Q2, and we anticipate we will continue to add if the price remains in this range.We see earnings potential of $2.20 per share in 2030, meaning you’re paying only 5x few years out earnings for a quality compounder with an excellent management team. At 25x earnings, the stock would trade in the mid $50’s, implying an average annual gain of 37% (in line with the historical precedent). Even if multiples compressed to 15x, the stock could gain more than 20% per year. We’ve analyzed a range of scenarios and believe QXO offers one of the most attractive risk-rewards we’ve encountered.
QXO recently closed on TopBuild, which Jacobs’ expects will be his best acquisition yet. We have confidence in management. We like the collection of businesses QXO has acquired in a space well insulated from AI risks. We see significant potential for improvement, and further acquisitions. As Munger reminds us, when the potential rewards substantially outweigh the risks, we should act decisively. Though it’s weighing on our near-term performance, we’re following his advice and patiently awaiting the payoff.
Precigen (PGEN $7.60) has been a huge homerun since we led their capital raise at the end of 2024. Since then, the stock is a 10-bagger2. Gains have been driven by a successful launch of its first drug, Papzimeous, for the rare and devastating disease, recurrent respiratory papillomatosis, which is caused by HPV virus. Precigen has worked out fantastically, but success was never guaranteed. When we initially invested, we believed the enormous upside potential more than compensated for the downside risk. It only takes a few big winners to pay for many losers.
We met with management recently and continue to see significant upside potential. The underlying technology of Papzimeous, Adenoverse, was recently granted FDA platform designation. This eases approval requirements for other Adenoverse related treatments, such as for HPV cancers. Precigen will report trial results soon for head-and-neck and cervical cancer – we are expecting solid results. We also see significant potential in its CAR-T program. After its move, Precigen’s stock price is $7.60, which doesn’t yet fully reflect the value of Papzimeous, let alone the other pipeline assets.
Royalty Pharma (RPRX $56.21) and United Healthcare (UNH $370.95) are significant contributors for the year, but we continue to like the risk-reward in each. Royalty Pharma is a master capital allocator providing critical funding for the biopharma industry. They dominate the market for large deals. With a return on capital in the high teens and low-to-mid-teens earnings growth, we think its 16.7x 2027 owners’ earnings3 multiple remains attractive. United Healthcare is early in its earnings recovery with an excellent management team. For the next few years, earnings should grow in the mid-teens in most environments. Both companies add ballast to the portfolio.
Citigroup (C $128.08) is another of our significant winners as CEO Jane Fraser successfully executed a turnaround. We don’t think the work is done. Return on tangible common equity should be 11.5% in 2026, up from 2023’s trough of 4.8%. We expect it to rise to the mid-teens by the end of the decade, which should support stock gains in the mid-teens per year as well. The current valuation at 10x 2027 earnings is undemanding.
We continue to believe Mag 7 holdings Google (GOOGL $348.29), Meta (META $720.89) and Amazon (AMZN $254.06) represent some of the most attractive opportunities in the market with 2027 P/E multiples between 21-24x and operating income growth north of 20%. They’ve all lagged the market this year after previously being top performers. We think they have advantages in data, capital, technology prowess and culture, which position them well to be winners in an AI-dominated future. In our view, Google and Amazon have clearly demonstrated strong returns on capital of their AI investments, and Meta’s recent Muse launch was a good start. We see excellent risk rewards and numerous ways to win.
I discussed Nvidia (NVDA $230.48) earlier. We remain optimistic. Nvidia CEO Jensen Huang has been the top statesman and visionary during this boom. He’s helped launch new customers and planted seeds for additional revenue streams. Unless one believes an earnings peak is imminent – and we don’t – next year’s < 15x earnings multiple is extraordinarily attractive.
Chime (CHYM $28.96) is our final top ten, and one we’ve continued to accumulate. We think this is a long-term compounder. Renowned investor Nick Sleep made famous his investment paradigm of “scaled economies shared”. He owned Amazon and Costco, both of which were low-cost providers that shared those benefits with their customers, creating a durable growth flywheel. We see the same dynamics with Chime. It is a low-cost provider for primary banking relationships, and it’s built a beloved brand. It adds more new checking account relationships than any other bank, including Chase and Bank of America. Its unaided brand awareness recently surpassed Bank of America. We think management is excellent, as is the long-term potential. We think the stock is worth $47, 68% higher than the current price.
Borges's story ends tragically. Yu Tsun, the protagonist, kills the very man who solved his ancestor's time riddle, despite having imagined his future as irrevocable as the past. Despite accomplishing his mission, he's left with "innumerable contrition." Borges leaves us wondering whether his fate was inevitable or he could have chosen another path.
Investing presents a similar challenge: we must make decisions today without knowing which of many possible futures will unfold. It requires imagination to envision the possibilities, discipline to weigh the odds, and judgment to assess the potential rewards against the risks. Fortunately, these efforts are both obtainable and more profitable than most prediction.
1The Strategy does not invest directly in cryptocurrencies. The Fund obtains indirect exposure to Bitcoin through its holding of the Fidelity Wise Origin Bitcoin Trust (FBTC).
2A 10-bagger is an investment that grows to 10 times its initial purchase price.
3Owners’ earnings is earnings from their portfolio less costs and capital investment required to sustain earnings stream.
Appendix 1:
AI’s Notable Accomplishments
- Nobel Prize for protein folding. AlphaFold predicted the structures of 200M+ proteins—nearly every protein known to science contributing to the 2024 Nobel Prize in Chemistry. Nobel Prize
- Designed drug for an incurable lung disease: AI identified a new biological target and designed rentosertib for idiopathic pulmonary fibrosis (IPF), a progressive scarring of the lungs with no cure, taking the AI-discovered drug all the way into a randomized Phase 2 human clinical trial. Nature Medicine
- Discovered millions of new materials: DeepMind’s GNoME predicted 2.2 million previously unknown crystal structures, including 380,000 promising stable materials that could potentially improve batteries, semiconductors, solar cells and other technologies. Google DeepMind
- Mathematics Advances: In Sept 2026, an OpenAI model produced a proposed solution to the Navier–Stokes Millennium Prize Problem, showing that the fundamental equations governing fluid flow can develop singularities (“blow up”). The result—one of seven $1 million Millennium Prize Problems—could represent the first major unsolved mathematical problem solved by AI. It is still undergoing expert scrutiny. Nature. On Oct 6, OpenAI announced that frontier AI model generated solutions to hundreds of previously unsolved mathematical problems, publishing 722 research manuscripts spanning 372 groups of results
- Invented better computer algorithms: AlphaEvolve discovered algorithms that recovered 0.7% of Google’s global computing capacity, made a key Gemini computation 23% faster, accelerated FlashAttention by up to 32.5%, and improved a matrix-multiplication result based on an algorithm that had stood since 1969. Google DeepMind
- Outperformed a world-leading weather system: DeepMind’s GenCast beat the European Centre’s leading ensemble forecasting system on **97.2% of 1,320 measures—and 99.8% beyond 36 hours—**while generating a 15-day global forecast in roughly eight minutes.Nature.
- Improved cancer detection while reducing doctors’ workload: In a randomized mammography trial of 100,000+ women, AI-assisted screening detected roughly 29% more cancers while cutting radiologists’ screen-reading workload by ~44%, without a significant increase in false positives. Lancet Digital Health
- Fully draft a company’s code: Airbnb CEO Brian Chesky predicts, “Almost nobody next year at Airbnb will be writing any lines of code,” illustrating the rapid shift from engineers manually writing software to directing AI systems that generate it.
- Dramatically increased worker productivity: In a study of 5,179 customer-support workers handling real technical problems, AI increased productivity 14% overall and ~34% for novice/lower-skilled workers, allowing relatively inexperienced employees to perform more like veterans.NBER
- Multitrillion-dollar investment boom: Meeting expected computing demand could require nearly $7 trillion of global data-center investment through 2030, driving massive spending on chips, servers, power generation, electrical equipment, networking, construction and real estate. McKinsey
- Enormous new source of electricity demand: Global data-center electricity consumption is projected to roughly double to ~950 TWh by 2030—more than Japan consumes today—with data centers accounting for nearly half of U.S. electricity-demand growth through 2030.IEA
- Fastest economic adoption curves: Generative AI has moved from a research breakthrough to routine use in only a few years, giving it one of the fastest adoption curves of any major general-purpose technology. Stanford AI Index. ChatGPT reached 1 billion monthly users in roughly 3½ years—versus ~5 years for TikTok, ~8 years for Instagram, and ~8½ years for Facebook, 21 years for the mobile phone and 36 years for the Internet.
- Model companies set historical revenue-growth records: OpenAI and Anthropic have scaled from near-zero commercial revenue to tens of billions of dollars in annualized revenue in only a few years; Anthropic alone surged from roughly $1B to $65B in 19 months. Previous technology champions such as Salesforce and Google took roughly a decade or more. Axios.
FOR INSTITUTIONAL INVESTORS ONLY
Stock prices as of 10/8/26
The views expressed in this commentary reflect those of Patient Capital Management portfolio managers as of the date of the commentary. Any views are subject to change at any time based on market or other conditions, and Patient Capital Management disclaims any responsibility to update such views. These views are not intended to be a forecast of future events, a guarantee of future results or investment advice. Because investment decisions are based on numerous factors, these views may not be relied upon as an indication of trading intent on behalf of any portfolio. Any data cited herein is from sources believed to be reliable, but is not guaranteed as to accuracy or completeness. The information presented should not be considered a recommendation to purchase or sell any security and should not be relied upon as investment advice. It should not be assumed that any purchase or sale decisions will be profitable or will equal the performance of any security mentioned. References to specific securities are for illustrative purposes only. Portfolio composition is shown as of a point in time and is subject to change without notice. Portfolio Holdings, composition and weightings are based on the holdings of the representative account for the strategy that may also participate in leverage from time-to-time.
All historical financial information is unaudited and shall not be construed as a representation or warranty by us. References to indices and their respective performance data are not intended to imply that the Strategy’s objectives, strategies or investments were comparable to those of the indices in technique, composition or element of risk nor are they intended to imply that the fees or expense structures relating to the Strategy or its affiliates, were comparable to those of the indices; since the indices are unmanaged and cannot be invested in directly.
Forward Price to Earnings Ratio (Forward P/E) is a financial valuation metric that divides a company’s current stock price by its expected earnings per share. S&P 500’s forward P/E multiple is the most recent S&P 500 index price divided by consensus estimates for earnings in the next 12 months. Earnings per share (EPS) is the portion of a company’s profit allocated to each outstanding share of common stock and serves as an indicator of a company’s profitability. Earnings growth is not representative of the Strategy’s future performance. Free Cash Flow is earnings before depreciation, amortization, and non-cash charges minus maintenance capital expenditures. Mag 7 refers to the Magnificent 7 stocks are a group of large-cap companies in the technology sector, including Alphabet (GOOGL), Amazon (AMZN), Apple (AAPL), Meta (META), Microsoft (MSFT),Nvidia (NVDA), and Tesla (TSLA) that due to their size and performance accounted for roughly one-third of the S&P 500’s total market capitalization.
Return on Tangible Common Equity is a profitability ratio that measures a company's net income available to common shareholders as a percentage of its average tangible common equity. Tangible common equity is a financial measure that calculates a company's physical capital by subtracting intangible assets (such as goodwill or patents) and preferred equity from its total book value
Portfolio holdings and portfolio discussion are for a representative Opportunity Equity account. Holdings discussed may or may not be included in all portfolios subject to account guidelines.
The performance information depicted herein is not indicative of future results. There can be no assurance that Opportunity Equity’s investment objectives will be achieved and a return realized. Returns for periods greater than one year are annualized.
| QTD | YTD | 1-Year | 3-Year | 5-Year | 10-Year | Since Inception (12/30/1999) | |
| Opportunity Equity Strategy (gross of fees) | 4.57% | 15.78% | 23.44% | 31.22% | 10.12% | 14.42% | 9.87% |
| Opportunity Equity Strategy (net of fees) | 4.32% | 14.93% | 22.24% | 29.94% | 9.03% | 13.29% | 8.79% |
| S&P 500 Index | 2.30% | 12.75% | 15.74% | 22.89% | 13.79% | 15.33% | 8.34% |
The Opportunity Equity composite performance figures reflected above include the deduction of a model investment management fee of 1% (the highest fee for separate accounts under our fee schedule), paid quarterly and certain other expenses. For important information about Opportunity Equity Strategy performance, please click on the Opportunity Equity Strategy Composite Performance Disclosure. Past performance is no guarantee of future results.
Click for the Opportunity Equity Strategy Composite Performance Disclosure.
Past performance is no guarantee of future results.
©2026 Patient Capital Management, LLC
Share