Change
By: Kathleen Raine
Change
Said the sun to the moon,
You cannot stay.
Change
Says the moon to the waters,
All is flowing.
Change
Says the fields to the grass,
Seed-time and harvest,
Chaff and grain.
You must change said,
Said the worm to the bud,
Though not to a rose,
Petals fade
That wings may rise
Borne on the wind.
You are changing
said death to the maiden, your wan face
To memory, to beauty.
Are you ready to change?
Says the thought to the heart, to let her pass
All your life long
For the unknown, the unborn
In the alchemy
Of the world's dream?
You will change,
says the stars to the sun,
Says the night to the stars.
Another year in the history books. How do the years fly by so quickly? I enjoy this time of year. Things typically slow down (though not for us this year). There’s time to reflect. The new year ushers in the possibility of change and new beginnings.
After such a strong year, investors hope for more of the same, rather than something different. The S&P 500 registered its second 25%+ return year in a row, the first such occurrence since the Tech Bubble. Only, change is inevitable. It’s just a question of how things will be different.
In my second year as sole manager of the Opportunity Equity Strategy, we pulled off a “Silky Sullivan” finish, surpassing the market late in the year to end up 26.5%, 150bps ahead of the S&P 500’s 25.0%. Like most of our team and my family, you may not be familiar with Silky Sullivan.
Back in our Legg Mason days, Silky Sullivan was our mascot. His come-from-behind finishes (check out the video) inspired hope and optimism when we lagged the market late in the year. There were many years during Bill Miller’s Value Trust streak where the fund pulled ahead late in the year, including his second year as sole manager. Interesting how history rhymes.
Fun fact: my 11-year-old son now yells, “Silky Sullivan on the outside,” as he passes me on the slopes. It seems like just yesterday he was too little to ski. Now even my 6-year-old “baby” is losing most of her baby fat. Alas, change.
We had a productive end to the year. We closed a private deal with one of our companies, Precigen (PGEN $1.18), which had us burning the midnight oil during the holiday season. We were optimistic it would prove lucrative for our investors, and so far, it has, with the stock up 60% since the deal was announced.
Precigen is a cell and gene therapy company. We expect later this year it will receive FDA approval and launch its first therapy for respiratory papillomatosis. The most interesting aspect of Precigen is the platform nature of its IP. It has numerous programs that enhance efficacy, delivery, safety and scalability of cell and gene therapies. In our opinion, none of this potential is priced into the stock. Precigen, under CEO Helen Sabzevari, has done an excellent job driving programs through clinical trials quickly and efficiently. Before the deal, Precigen’s limited cash resources created solvency risk that weighed on the stock. The deal solved the cash needs, which allowed the stock to rebound nicely. We believe the company’s cash runway now extends through approval and commercialization.
A Year Ago vs. Now
As for change, it’s amazing what a difference a year or two makes. We’ve traversed the terrain of pessimism into optimism.
At the end of 2022, strategists forecast double-digit 2023 market declines (after an 18% S&P 500 drop for that year). The market humiliated the group, delivering a top-notch 26% gain. Not easily deterred from unlikely projections, strategists called for a flat 2024. (Since 1926, only 3 (of 99) years have been +/- 1%). To which, the market served a second-in-a-row 25%+ return year (which hasn’t happened since 1997-1998). Finally, for 2025, projections call for a normal year, averaging 10.4%, close to the long-term 10% average. The tide of comfort is rising.
Other indicators suggested significant bearishness a year ago. In December 2023, ETFs registered their largest month of net outflows, put-to-call ratios were above 1 and Citigroup’s Levkovich Index (formerly known as fear-greed index) still registered negative numbers. Recession fears loomed large.
More recently, we concluded a record year for ETF inflows in 2024, with November the best month ever. The Levkovich Index has been sitting in “greed” territory for months. Public sentiment has finally shifted towards a soft-landing scenario. Valuations reflect the elevated mood. The S&P 500’s forward 1-year price-to-earning’s multiple rose from 19.7x a year ago to 21.7x (still below 2000’s 25.2x peak).
We prefer investing when fear infiltrates every nook and cranny, yet optimism isn’t a death-knell for bull markets. Low expectations can make for easy intellectual (yet gut-wrenching) calls. In the fall of 2023, we believed OneMain Financial (OMF $52.46) priced in recessionary earnings, yet a recession would cause further losses before a recovery. The stock returned 45% since the end of that third quarter. Optimism, on the other hand, creates more risk that fundamentals fall short of expectations.
That’s where we sit today. Any number of things, from rising interest rates or inflation to economic growth concerns, could spook the market.
The more things change, the more they stay the same. Risk meets opportunity. Climbing the proverbial wall of worry advances the market.
Some of the best returns occur late in bull markets. Numerous successful investors describe 4 stages of bull markets. Most famous is Sir John Templeton’s epic quote that “bull markets are born on pessimism, grow on skepticism, mature on optimism and die on euphoria.” Birinyi Associates, which has a long track record of success, divides bull markets into four stages: skepticism, consolidation, acceptance and exuberance.
Ascertaining where exactly we sit can be more art than science. What’s clear: we remain in a bull market and sentiment is rosier than a year or two ago. The current correction has burned off some enthusiasm fortunately. Birinyi judges we are at the mid-point of the acceptance stage. In their framework, the skepticism and exuberance stages generate the highest returns.
Some euphoric conditions exist, such as for certain quality compounders (e.g.- Costco Wholesale (COST $927.37) at 51x earnings), retail options activity and quantum computing. Many think bitcoin, Mag 7 and AI should be added to the list. I disagree.
We believe we’re still early in bitcoin’s lifecycle. Despite the availability of ETFs, most advisor platforms still restrict access. Bitcoin’s strong 127% historical 1-year gain parallels historical moves off lows. In the past, it’s taken a couple additional years to form an interim peak. We made an initial investment in the Fidelity Wise Origin Bitcoin ETF (FBTC $82.02) in the quarter after finalizing required backend setup.
The Mag 7’s significant gains and indisputable leadership draw attention. For the most part, their fundamentals justify their stock performance and leadership (much to the chagrin of active managers hurt by their underweight positions).
Excluding Tesla (TSLA $394.94), the group trades at 27x 2025 earnings with a 43% average return on invested capital (ROIC) and 19% average estimated revenue growth. The 25% valuation premium to the market is dwarfed by the ROIC, revenue growth and free cash flow margin premiums. The subset owned by Patient Capital (Alphabet (GOOGL $193.95), Amazon.com (AMZN $222.13), Meta Platforms (META $610.72), and Nvidia (NVDA $140.11)) trades at a lower valuation than the group, with better fundamentals (ROIC, growth). It’s difficult to argue excessive aggregate valuations unless forecasted fundamentals are way off the mark.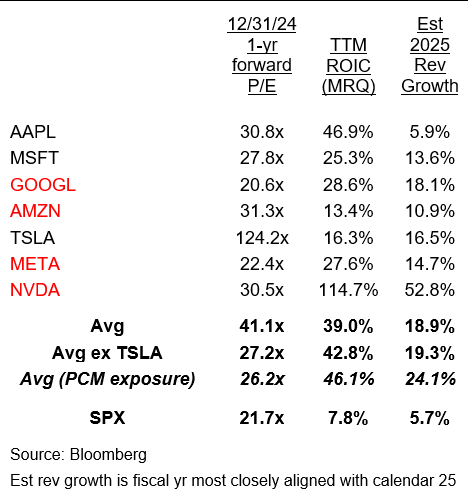
Given the AI revolution, it’s difficult to foresee that. The most brilliant technology experts all seem to agree AI will transform the world. Given the massive data and capital requirements, advantages accrue to scaled incumbents (e.g.- Mag 7).
In markets, it’s always challenging to discern signals from noise. Bill Miller’s long tenure and successful track record make him better equipped than most to do so. In a recent conversation about the market’s strong gains and rising valuations, he remarked: “what most people don’t get is we are in the midst of a technological revolution.”
We’ve believed a Tech Bubble/Nifty Fifty 2.0 scenario was a reasonable probability. Market action, including Tech Bubble-like consecutive 25%+ return years and Mag 7 leadership, elevate those odds. We’re not there yet in our opinion.
Howard Marks, the renowned value investor who called the Tech Bubble almost perfectly recently remarked in the Financial Times, “the forward p/e ratio on the S&P 500 is high but not insane… I don’t hear people saying, “there’s no price too high” and the markets – while high-priced and perhaps frothy – don’t seem nutty to me.”
At the same time, a more significant pullback is likely in 2025. Most years include 10% pullbacks. The Tech Bubble had a few, including in 1999. 1998 even hit the official -20% bear market territory on an intraday basis. We came close to -10% in Aug 2024 but didn’t quite hit the mark. Pullbacks are healthy and help alleviate market excesses, but never feel that way.
Considering the evolving environment, let’s review how we’ve changed the portfolio over the past year (year end 2023 to year end 2024).
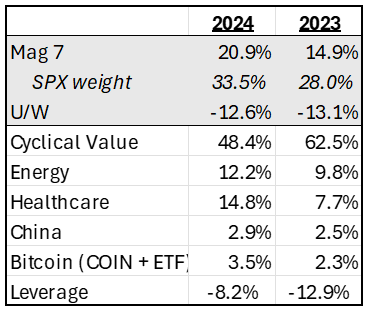
Our Mag 7 exposure (20.9%) increased primarily due to our Nvidia purchase in Jan 2024 and secondarily through market appreciation. Our underweight to the market (-12.6%) shrunk modestly.
You might be surprised by our high “cyclical value” exposure (48%). In this context, “value” refers to low multiple names (which is not how we think of value broadly). Stocks with low multiples tend to have some perceived problem: disappointing fundamentals, secular risk, cyclical or volatile earnings, etc. We prefer the “problem” of cyclicality, which we see as no problem at all.
We think it creates opportunity. The market often extrapolates short-term results, or myopically focuses on short-term trends and risks, allowing us to “monetize volatility”. It often discounts quality cyclicals more than warranted. The poor conditions people fear eventually improve.
Our exposure to cyclical value[i] has dropped by 20% over the past year as prices rose. The market’s punitive pricing for some cyclicals dissipated as soft-landing expectations escalated. We rotated exposure out of names with less upside into names we deemed more mispriced, like Dave & Buster’s Entertainment (PLAY $29.38), which has gotten hit hard.
As the environment normalized, we took leverage down by 36%. If the market continues higher as we expect, we will look for further opportunities to pare back leverage to preserve capacity for future declines.
We still see pockets of pessimism, to which we’ve been actively adding. Weights in healthcare and energy rose significantly, while China exposure grew more modestly. All three areas significantly trailed the market last year. We see some of our greatest upsides to intrinsic value in these laggards.
In energy, oil supply glut concerns weighed on the sector. The cardinal rule for commodities: no one has a clue about future prices. We aim to value cyclical companies at mid-cycle pricing ($60-65/bbl WTI in our view). For Kosmos Energy (KOS $3.75), we think intrinsic value is triple the current price. Free cash flow will grow substantially this year as capex declines significantly. Seadrill (SDRL $37.80) is worth double the current price, in our opinion, and is an acquisition target.
Energy companies are highly correlated with commodity prices. Things could get worse before they get better, but we have conviction these investments will eventually reward us handsomely.
We are particularly excited about our healthcare names, including Royalty Pharma (RPRX $26.20), Biogen (BIIB $150.75) and CVS Health (CVS $46.01), which all trade at significant discounts to what we think they’re worth. They also provide ballast to the portfolio and protection against any economic growth concerns that might arise.
Royalty Pharma owns a diversified stream of royalty income. It’s run by a savvy group of investors. It trades for 5.9x this year’s earnings with a 3.3% dividend yield. We expect earnings per share growth in the high-single-to-low-double-digit range. We think this team understands value creation and wouldn’t be surprised to see them get more aggressive with share repurchases at the current stock price (after the writing of this letter, RPRX made a number of favorable announcements including a larger share repo).
CVS has a 5.8% dividend yield, an engaged activist on the Board (Larry Robbins from Glenview) and an excellent new CEO (David Joyner). Its primary problem, poor underwriting in the Aetna insurance unit, is fixable. We expect mid-teens annualized returns over the next few years as the turnaround progresses.
Biogen trades for less than the value of their current drugs on the market. The market is ascribing no value to Alzheimer’s, which could be huge, or to the pipeline. CEO Chris Viehbacher has historically delivered accretive deals, which the market also ignores. Our intrinsic value estimate is more than double the current stock price.
When we add laggards to the portfolio, they typically weigh on short-term performance. We firmly believe the best path to riches is uncovering opportunities where market expectations fall far short of business fundamentals. The investor subset willing to buy into price weakness is a vanishing breed. Another big change since I entered markets, and one that creates both risks and opportunities. It creates more extreme price moves, elevating the risk of being early. It also creates more sizeable potential gains.
Short-term trends (or perceptions of trends) matter most to many investors. Gaps between market expectations and intrinsic values don’t drive prices, revisions to expectations do. Expectations eventually follow fundamentals, but patience is typically required.
As an example, we’ve written about our enthusiasm for travel names over the past couple years. Until the fourth quarter, many continued to lag despite strong fundamentals. When the market finally reassessed the odds of a recession, the names surged.
Our stocks (Expedia Group (EXPE $182.62), United Airlines (UAL $103.72), Norwegian Cruise Line (NCLH $25.92), and Delta Air Lines (DAL $61.42)) returned an average of 35% in the quarter vs. SPX’s 2%, taking full year returns to 60% and 25%, respectively. Most investors attempt to surf along trends and time their entry perfectly. We do something quite different. We seek areas of pessimism or skepticism where Mr. Market fails to properly price underlying business fundamentals. We then wait patiently for the shift that allows convergence. Patience (and sound analysis) are key.
While the external environment changes constantly, consistency defines our philosophy and process. As the Dalai Lama says, "Open your arms to change but don't let go of your values."
Ten-Year Review: Personal Track Record
Speaking of patience, 2024 marked the 10th birthday of the Patient Strategy, the first strategy I managed independently. It’s instructive to review past results to understand sources of strength, weakness and areas for improvement. Anyone invested, or thinking of investing, with us might likewise find it useful.
Overall the Patient Strategy returned 15.2% per year gross and 14.1% net returns (assumes 1% annual fees). While we met our mid-teens return hurdle and outpaced our primary benchmark, the S&P 500, by ~100bps annually, I would have expected to outperform by more in such a strong return environment. 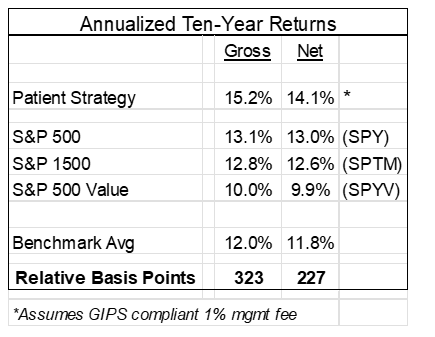
Several factors dragged on performance. Exposure to value and smaller-caps, both of which significantly lagged the market over the decade, weighed on returns. Relative to a blended index of S&P 500, S&P 1500 and S&P 500 Value, we did better (+227bps). Market leadership changes over time. We have confidence value and small-caps’ relative performance will improve at some point, and our flexible approach is an asset.
Our performance during the 2021-2022 bear market was the biggest disappointment. We are intent on doing better in the future. We learned valuable lessons including new risk monitoring to alert us to risks like peaking bubbles. We’ve sharpened our focus on nearer-term (which to us means 5-year) fundamentals. We are confident our improvements will help us better navigate future bear markets.
Overall, we are proud we were able to deliver excess returns, which is no small feat in hyper competitive markets. We kept pace with top managers we follow. We surpassed all other value funds we follow whom we admire greatly. We were competitive with the growth funds, though lagged several, which is not surprising given our strong value-orientation.
We think the key characteristics that generated our strong performance were: 1) an empirically sound, enduring process that focuses on company fundamentals relative to market expectations, 2) flexibility and adaptability and 3) an insatiable desire to deliver for clients. We find opportunity in diverse companies including compounders, classic value and early-stage companies. We look where others won’t. We try to understand where the biggest future opportunities lie.
Looking forward, we continue to aspire to deliver mid-teens returns, though we expect that will be a tall order over the next decade. With higher valuations and sentiment than 10 years ago, market returns will surely be lower (we estimate 6-8%). Value, though, should do better relatively.
While the future will bring continual change, as always, the core tenets of our philosophy and process will remain constant. We believe human and institutional behavior creates enduring market inefficiencies. If we continue to execute sophisticated fundamental analysis with an intense drive to succeed and mental flexibility, we should be able to continue to deliver excellent results.
[i]Note: Individual stock prices as of 1/8/25
Data Sources: Bloomberg, Patient Capital Management
The NASDAQ Composite Index is a market capitalization-weighted index that is designed to represent the performance of NASDAQ securities and it includes over 3,000 stocks. The Dow Jones Industrial Average (DJIA) is an unmanaged index composed of 30 blue-chip stocks, each with annual sales exceeding $7 billion. The DJIA is price-weighted, reflects large-cap companies representative of U.S. industry, and historically has moved in tandem with other major market indexes, such as the S&P 500. The Russell 2000 Index is a small-cap stock market index that makes up the smallest 2,000 stocks in the Russell 3000 Index. The S&P SmallCap 600 Index seeks to measure the small-cap segment of the U.S. equity market.The S&P 500 Index is a market capitalization-weighted index of 500 widely held common stocks. Investors cannot invest directly in an index and unmanaged index returns do not reflect any fees, expenses or sales charges. Magnificent 7 is a group of stocks made up of mega-cap stocks Apple (AAPL), Alphabet (GOOGL), Microsoft (MSFT), Amazon.com (AMZN), Meta Platforms (META), Tesla (TSLA) and Nvidia (NVDA). Sahm Recession Rule: Sahm Recession Indicator signals the start of a recession when the three-month moving average of the national unemployment rate (U3) rises by 0.50 percentage points or more relative to the minimum of the three-month averages from the previous 12 months. Leading Economic Indicators (LEI) is composed of 10 economic components whose changes tend to precede changes in the overall economy. Personal consumption expenditures (PCE), also known as consumer spending, is a measure of the spending on goods and services by people of the United States. The Nifty Fifty was a group of 50 large-cap stocks on the New York Stock Exchange that were most favored by institutional investors in the 1960s and 1970s. Capital Expenditures (CapEx) are funds used by a company to acquire, upgrade, and maintain physical assets such as property, plants, buildings, technology, or equipment. West Texas Intermediate (WTI) Crude Oil is the underlying commodity of the New York Mercantile Exchange's oil futures contract and serves as one of the main global oil benchmarks. Purchasing Managers Index (PMI) is an indicator of the prevailing direction of economic trends in the manufacturing and service sectors.
The information presented should not be considered a recommendation to purchase or sell any security and should not be relied upon as investment advice. It should not be assumed that any purchase or sale decisions will be profitable or will equal the performance of any security mentioned. References to specific securities are for illustrative purposes only. Portfolio composition is shown as of a point in time and is subject to change without notice.
Portfolio holdings and portfolio discussion are for a representative Opportunity Equity account. Holdings discussed may or may not be included in all portfolios subject to account guidelines.
Investors should carefully review and consider the additional disclosures, investor notices, and other information contained elsewhere in this document as well as the Offering Documents prior to making a decision to invest.
All historical financial information is unaudited and shall not be construed as a representation or warranty by us. References to indices and their respective performance data are not intended to imply that the Strategy’s objectives, strategies or investments were comparable to those of the indices in technique, composition or element of risk nor are they intended to imply that the fees or expense structures relating to the Strategy or its affiliates, were comparable to those of the indices; since the indices are unmanaged and cannot be invested in directly.
The performance information depicted herein is not indicative of future results. There can be no assurance that Opportunity Equity's investment objectives will be achieved and a return realized. Returns for periods greater than one year are annualized.
The views expressed in this commentary reflect those of Patient Capital Management portfolio managers as of the date of the commentary. Any views are subject to change at any time based on market or other conditions, and Patient Capital Management disclaims any responsibility to update such views. These views are not intended to be a forecast of future events, a guarantee of future results or investment advice. Because investment decisions are based on numerous factors, these views may not be relied upon as an indication of trading intent on behalf of any portfolio. Any data cited herein is from sources believed to be reliable, but is not guaranteed as to accuracy or completeness.
Click for the Opportunity Equity Strategy Composite Performance Disclosure.
©2025 Patient Capital Management, LLC
Opportunity Equity Annualized Performance (%) as of 12/31/24
| QTD | YTD | 1-Year | 3-Year | 5-Year | 10-Year | Since Inception (12/30/1999) | |
| Opportunity Equity (gross of fees) | 8.46 | 26.47 | 26.47 | 4.25 | 8.84 | 9.44 | 8.62 |
| Opportunity Equity (net of fees) | 8.20 | 25.23 | 25.23 | 3.22 | 7.76 | 8.36 | 7.54 |
| S&P 500 Index | 2.41 | 25.02 | 25.02 | 8.94 | 14.53 | 13.10 | 7.71 |
Related Content
Christina Malbon's 4Q24 Quarterly Investment Review
Share