Investors had no time to recover from last August’s sell off, which was followed by a retest in September before suffering the new year’s pain. For an investor base still traumatized by the losses suffered in the financial crisis, these swings proved too much. An already fragile market confidence broke. As a result, equity outflows spiked.
According to Morningstar, half of the funds they rank in the top 6% of all funds lost 10% of their assets in the 12 months ending in February. Over a tenth of those top managers suffered drawdowns of 25%. While it’s common for outflows to pick up as markets swoon, this sort of behavior after the massive rally we’ve encountered is nearly unprecedented. Over the three year period ending in March, the average gains of the Dow, the S&P and the Nasdaq range from 9.3% (Dow) to 15.7% (Nasdaq) annually. (As a side note, it is no coincidence that the best performing over the period (Nasdaq) is suffering the most this year – that is exactly the nature of markets). We’ve experienced annual gains greater than the long-term average, yet a pretty standard market pullback wreaked havoc on sentiment.
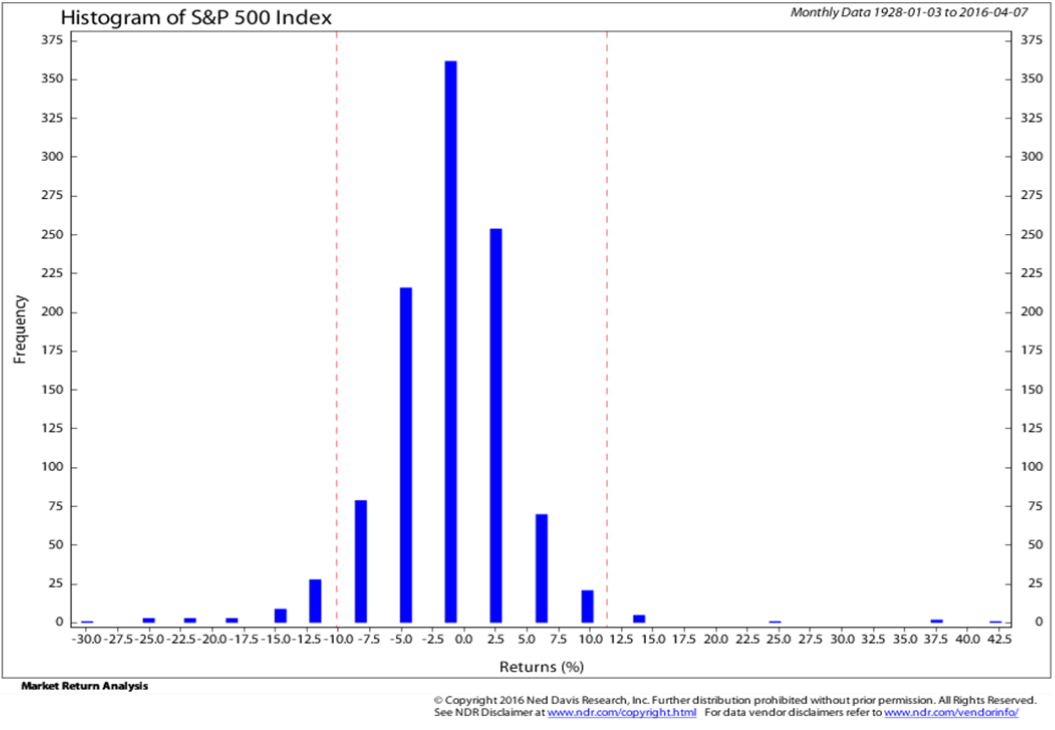
At the start of the year, stories abounded regarding the worst start to the year in many decades. The S&P 500 finished January down approximately 5%. Though it felt terrible, you can see in the chart below, losses of this magnitude occur frequently and should be expected. Much like the experience of delivering a baby, proper expectations do not diminish the actual pain experienced. In fact, a prior traumatic experience can escalate the agony (i.e- visceral hypersensitivity).
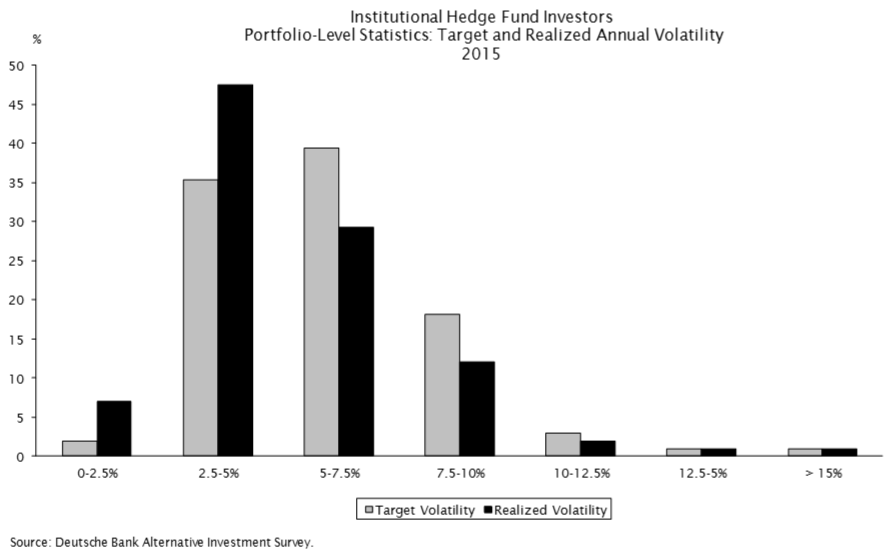
Structural changes make it likely that heightened volatility will remain a key feature of the market. According to Empirical Research Partners, hedge fund trading volumes now equal that of long only managers. Hedge funds earn high incentive fees for stable performance and avoiding big losses. A Deutsche Bank survey found that most hedge fund investors target volatility of roughly 5% (see chart below). This is a tough bogey given the historical volatility of corporate bonds is roughly 7-8%, and that of stocks reaches nearly 20%. Hedge fund investors pay for stability, not returns.
Used with permission from Empirical Research Partners. Not to be copied or redistributed without prior written consent.
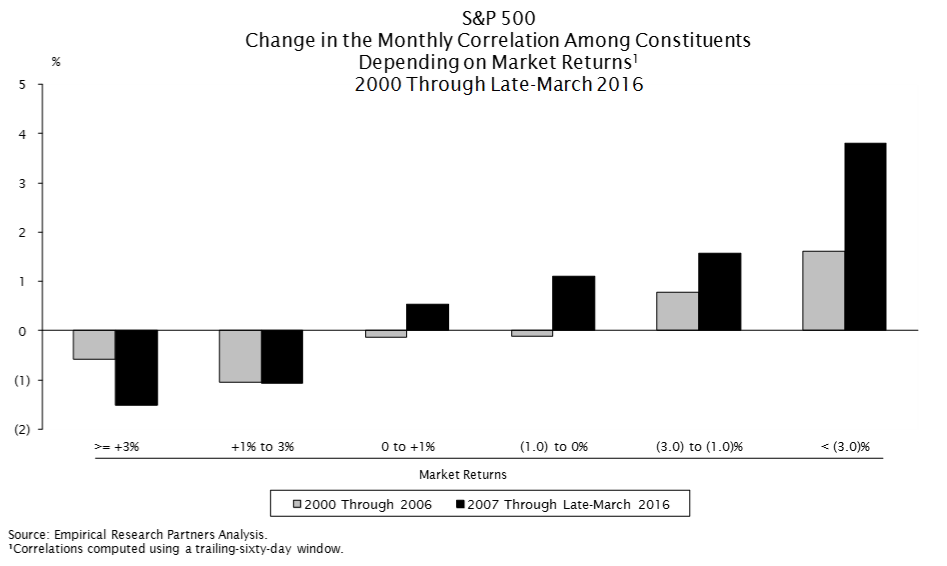
At the same time, globalization and the internet have conspired to synchronize market views and dramatize movements. Given the heightened demand for safety, hedging costs have risen dramatically since the crisis. Paying for a continuous hedge creates a real drag on performance (especially combined with high fees hedge funds charge). An alternative course requires one to react to market declines by getting more defensive. This is a key feature of “risk parity” strategies, but its popularity has grown substantially in other areas too. The result of all this: stability is extremely expensive and correlations spike during market weakness, as everyone rushes to sell to “manage risk” (see chart).
Used with permission from Empirical Research Partners. Not to be copied or redistributed without prior written consent.
During troubling times, the echo chamber screams of threats to your financial well-being. Perversely, in this environment, the biggest risk is overpaying for perceived “stability.” A recent Cornerstone Macro analysis concluded that a whopping 70% of the move down in Treasury yields this year is due to “safety flows”. In other words, only a small fraction of the move results from actual fundamental factors, such as growth and inflation expectations. It is primarily sentiment. People just crowded into what is perceived to be safe.
Likewise, a number of consumer staples companies, such as Johnson & Johnson, Colgate-Palmolive and Kimberly-Clark, recently hit 52-week highs. Most trade at significant premiums to the market and all only have modest growth potential. The allure of these names is not their money-making potential. Rather, people are drawn to the stability, income and defensiveness. But sentiment can change quickly.
The experience of MLPs (master limited partnerships of the energy index) perfectly illustrates this risk. These high yield vehicles traded as a bond proxy (much like staples and utilities currently) for a number of years with correlations between treasuries and MLPs reaching roughly 60% in 2012. People became enamored by the purported stability, income and potential growth (sound familiar?).
The dividend yield on the Cushing 30 MLP Index fell from 6.7% in 2010 to a paltry 4.4% in the second quarter of 2014. This illusion of safety vanished as the energy market fell apart and hidden risks came to light. The index lost over 2/3 of its value from the peak in 2014 to the trough in February. Yields blew out to 11.5%. Investors paying for safety got exactly the opposite.
Another peril in the current environment involves selling in response to market weakness and thereby making permanent long-term losses out of short-term market volatility. It’s wise to remember Benjamin Graham’s old adage, “In the short run the market is a voting machine but in the long run, it is a weighing machine.” Anyone watching the current presidential election can see the craziness of relying too heavily on the whims of the masses.
In markets, letting price moves dictate your actions can cause particular damage. You make fads your fate. In late 2011, the housing market was getting better, not worse. You certainly couldn’t tell from the stocks. In October, Pulte Homes traded at $3.29, down 57% from the start of the year ($7.58). The market “vote” did not reflect the underlying weight. The scale was broken. By the end of 2012, the market corrected course. Pulte closed at $17.60, more than five times higher than the lows. Anyone who thought there was signal in the price weakness, and sold near the lows (and many did!) made a false perception into an excruciating reality. The best antidote for volatile, herding markets requires independent thinking and a long-term orientation.
[bctt tweet="The best antidote for volatile, herding markets requires independent thinking and a long-term orientation." username="LMM_Investment"]
Market herding does create opportunity for those patient and independent enough to take advantage of them. The story in the first quarter contended that a recession loomed, as China’s weakness could not be contained and would harm prospects locally. People sold anything “cyclical”. Amongst large cap stocks, cyclicals represented more than 85% of the cheapest quintile of valuation, a level even greater than what was reached in the financial crisis! Companies get cheap because people don’t want to own them. No one wants to own anything perceived to have cyclicality.
Many names we own fell victim to this trend: banks, homebuilders, airlines and auto companies to name a few. Investors did not care to quantify the risk. When you actually estimate what these companies will earn in a recession (which we do) and how they’ve traded historically, it becomes clear that the market priced in a recession even if we didn’t have one. The good news is that means you are paid a lot to take the other side of that bet. If we avoid a recession and the stocks recoup losses, you will profit nicely – if the stocks in Opportunity return to their 52-week highs, it will rise over 90%. On the other hand, if we actually experience a recession, much of the downside has already occurred. I’ve seen estimates for the odds of a recession at ~25-35% -- most agree it’s quite unlikely in the near-term, making the opportunity in these names even more alluring.
Skeptics will say any earnings estimates are fraught with estimation error, and they are right. The financial crisis taught people to expect the unexpected, to beware of unforeseen risks lurking behind every corner and not to trust the soothsayers. However, the financial crisis and Great Recession were by definition an extreme outcome, and one made possible by the very fact that no one had experienced such a thing in nearly a century! But that’s different now. We all know intimately the scariness of that scenario. The Federal Reserve has since created an Index of Systemic Vulnerability that reached a high of 100% just prior to the crisis. It grew steadily from its early 90’s inception level of ~35%. Today, the calculation yields a result just over 20%, very low by historical standards.
At the same time, analysts, investors and risk managers all default to this extreme experience to gauge risk. The bank stress tests exemplify the change. Every year, the banks must examine on a loan by loan level how their business would fare in a disaster scenario. For 2016, this includes real GDP declining 6.25%, unemployment reaching 10%, home prices dropping 25%, equity prices falling 50% combined with a market shock worse than 2008 levels and the failure of their largest counterparty. Flashback, anyone? They can’t assume any offsetting actions and must assume they continue to pay dividends and buy back stock, which of course would not be the case.
Guess what? They all pass this test ANYWAYS. Their immense capital bases and big liquidity positions look entirely different from 2007. Do market prices reflect this reality? Nope. The trailing earnings yield of the large cap banks is approximately 500bps higher than the market, the largest premium since the tech bubble when tech and telecom names were outrageously expensive. The divergence between perception and reality reminds us of 2011.
Professional risk-takers dream of environments where actual risks are low, but high risk aversion results in high payoffs – exactly what we have now.
Meanwhile, the economy continues to grow. The Purchasing Managers’ Indices (PMIs) have improved, as have inflation expectations. The pace of dollar appreciation, and its resulting drag on corporate earnings, has clearly slowed, and possibly reversed. Employment growth continues to nicely outpace the level needed to sustain current low unemployment levels. Market stresses along with global weakness have caused the Fed to curtail its expectations for the pace of tightening. All this bodes well for future rates of returns.
The single best predictor of returns for our strategy is our calculation of the embedded upside in the portfolio. It continues to measure well into the triple digits, a high level by historical standards and one we haven’t experienced since late 2011 or early 2012. In 2011, fears about a financial crisis repeat caused the market, and our strategy, to sell off. When investors realized their mistake, the market and the strategy took off and did much better than anyone expected. Opportunity Equity doubled over the two year period of 2012 and 2013, notching gains twice that of the market.1 While we would never be so smug to suggest we can outperform so drastically again, one shouldn’t forget just how quickly and dramatically these repricings can occur.
We think the strategy is positioned extremely well right now. We are excited about its prospects and will continue to work hard to pursue exceptional returns for investors.
Read Opportunity Equity's 1Q 2016 Review
Thanks to Ned Davis Research and Empirical Research Partners for allowing us to reprint their charts.
1For important additional information on Opportunity Equity strategy performance, please click on the Opportunity Equity GIPS Composite Disclosure. This additional information applies to such performance for all time periods. Past performance is no guarantee of future results.
The views expressed in this report reflect those of the LMM LLC (LMM) strategy’s portfolio manager(s) as of the date of the report. Any views are subject to change at any time based on market or other conditions, and LMM disclaims any responsibility to update such views. The information presented should not be considered a recommendation to purchase or sell any security and should not be relied upon as investment advice. It should not be assumed that any purchase or sale decisions will be profitable or will equal the performance of any security mentioned. Past performance is no guarantee of future results.
©2016 LMM LLC. LMM LLC is owned by Bill Miller and Legg Mason, Inc.
Share